
This week’s housing data showed that the nation’s housing downturn has both steepened and broadened.
First, the latest Westpac-Melbourne Institute consumer sentiment survey revealed that house price expectations continued to fall in June, reflecting the actual value declines recorded across the nation’s housing market.
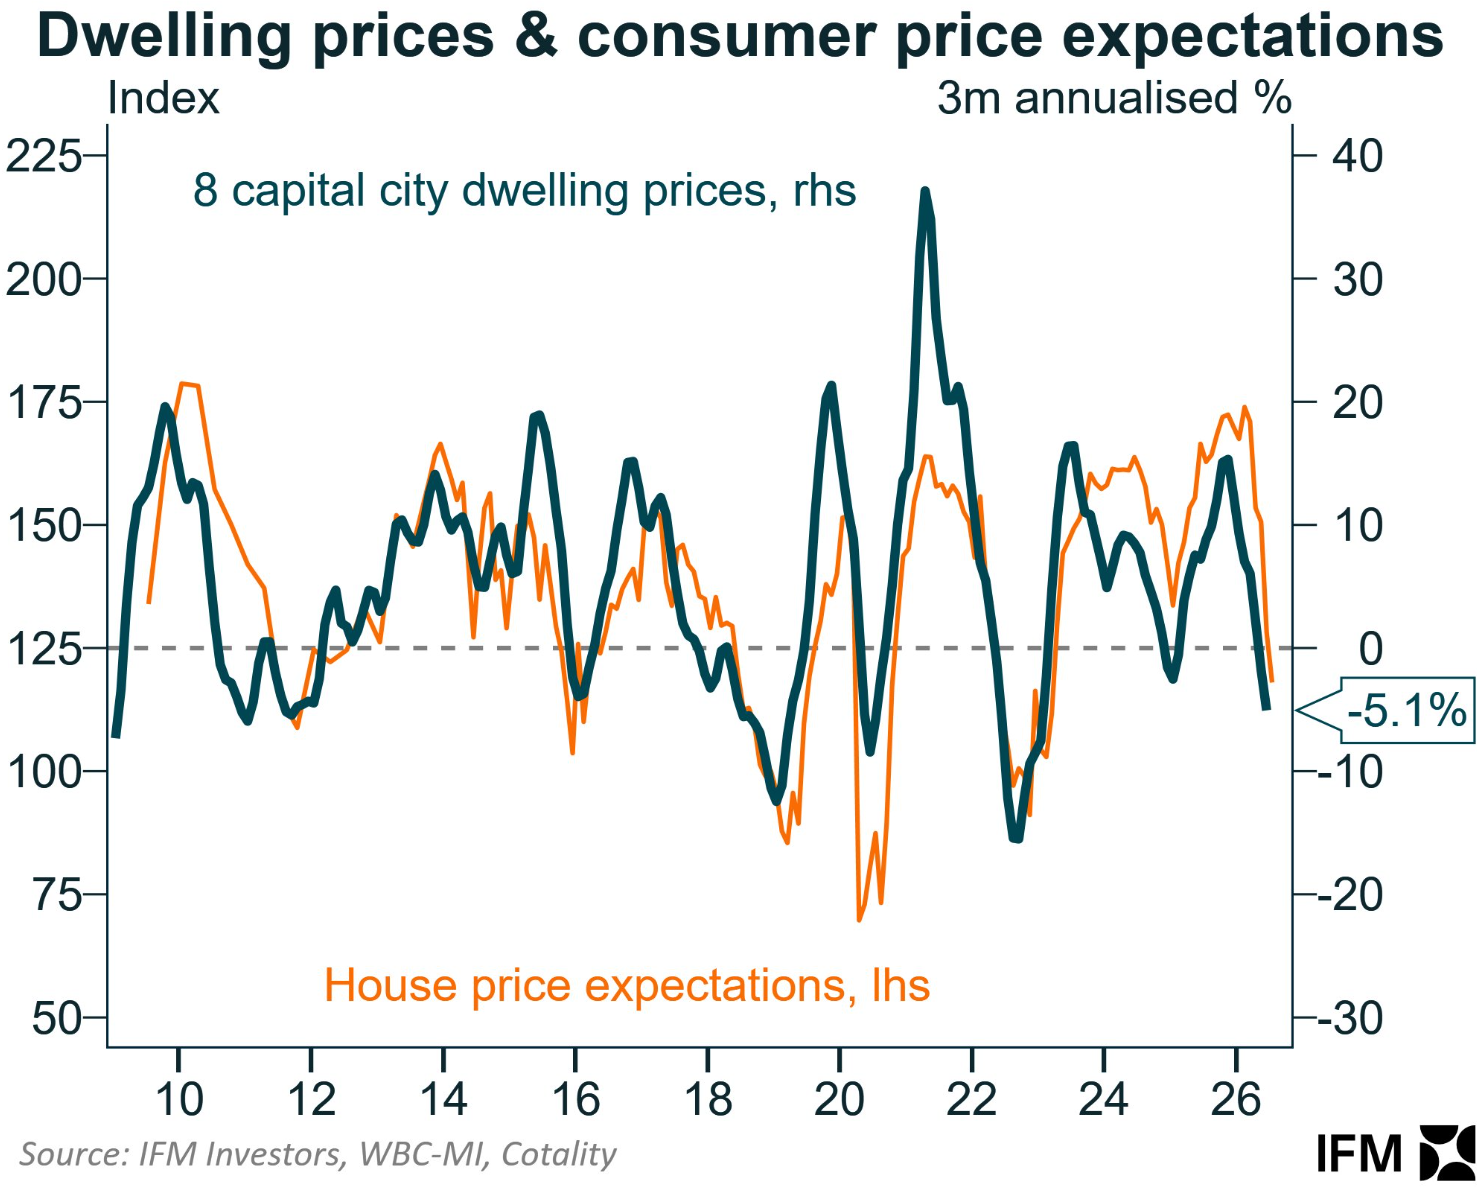
Chart by Alex Joiner (IFM Investors)
The latest survey was also the first time since March 2023 that fewer than half of consumers expect dwelling prices to rise.
Meanwhile, the nation’s auction market remains weak, with the national final auction clearance rate below 50% for the seventh consecutive week, suggesting further price falls.
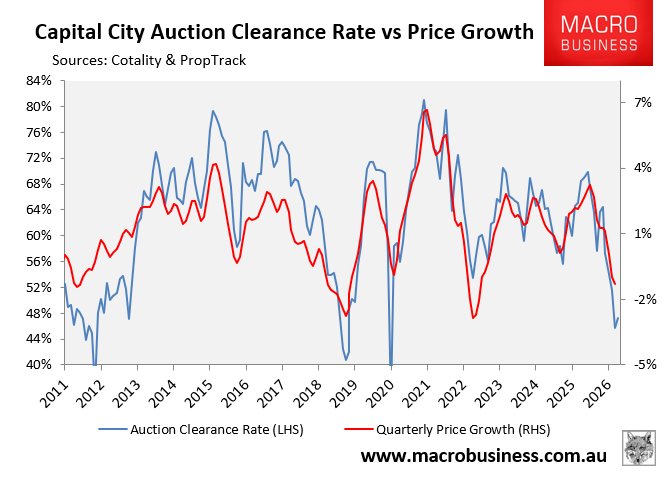
Auction conditions remain weak across the three largest capital city markets.
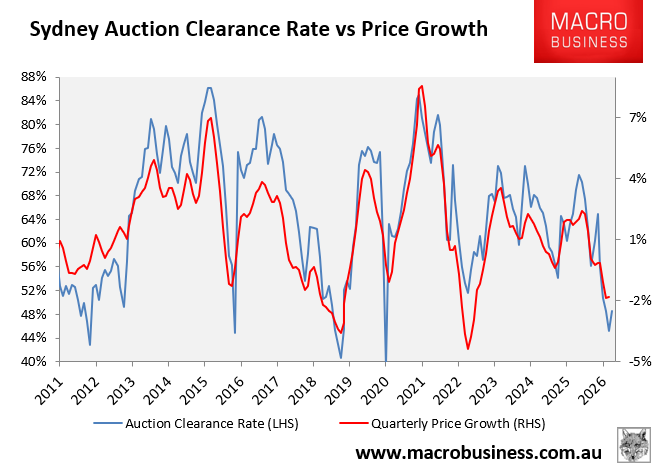
Sydney’s final clearance over the first two weeks of July is tracking at only 49%, up from 45% in June.
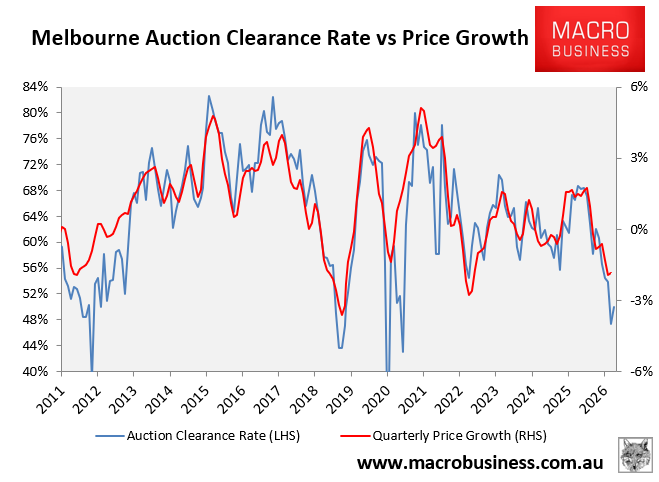
Melbourne’s final auction clearance rate is tracking at 50% over the first two weeks of July, up from only 47% in June:
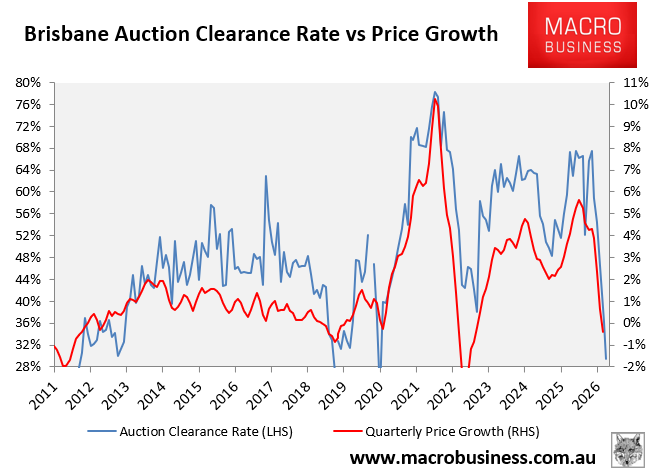
While not a major auction market, Brisbane’s final clearance rate is weakest of all, tracking at only 29% over the first two weeks of July, the softest reading since May 2020 during the COVID-19 pandemic:
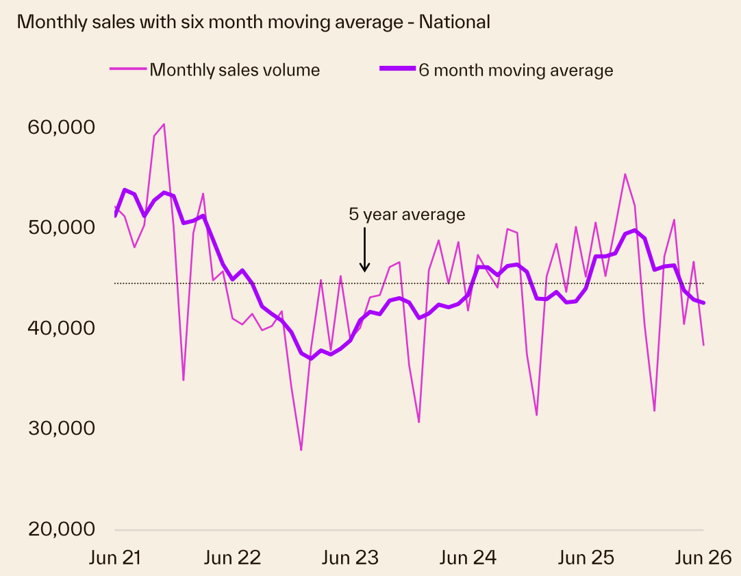
The auction market and sales data suggest that home buyers remain on strike. Cotality’s latest housing chart pack was released this week and showed that monthly sales volumes are tracking well below the five-year average:
Source: Cotality
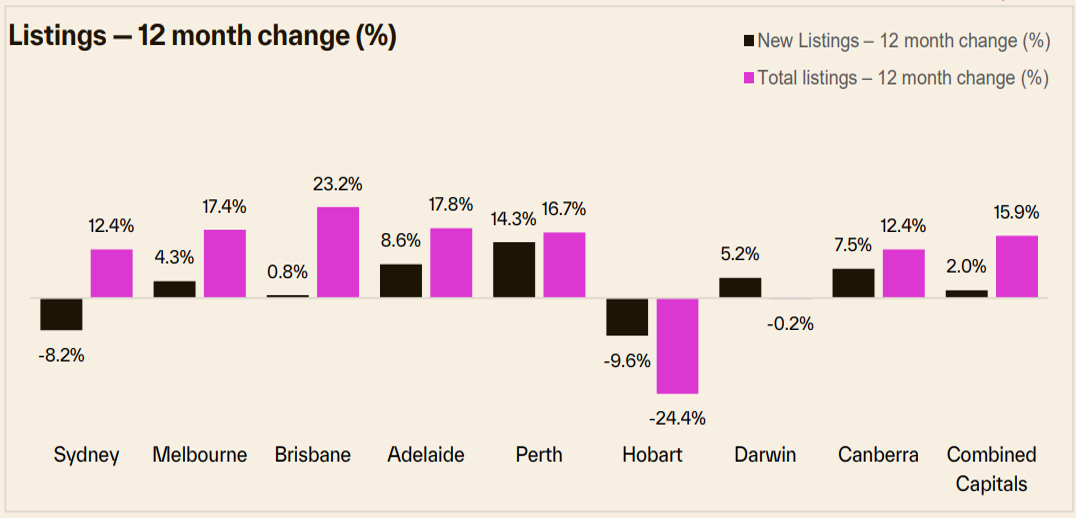
Meanwhile, for-sale listings continue to grow, tracking 15.9% higher than the same week last year, with Brisbane leading the rise:
Source: Cotality
Falling prices reflect the rising supply and softening demand.
Cotality’s daily dwelling values index recorded a 0.3% decline at the 5-city aggregate level in the week ended 17 July 2026, with all major markets apart from Perth recording falls.
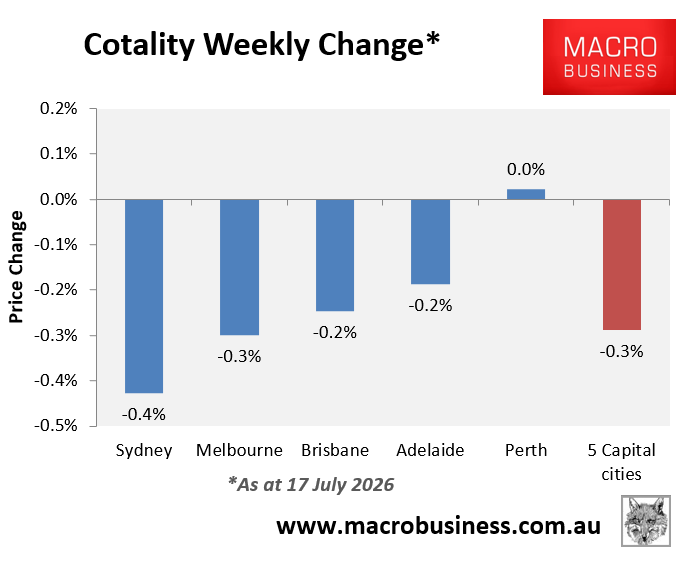
Over the month to 17 July, values have declined by around 0.9% at the 5-city aggregate level, led by Sydney (1.4%) and Melbourne (1.3%), with all major markets other than Perth also recording declines.
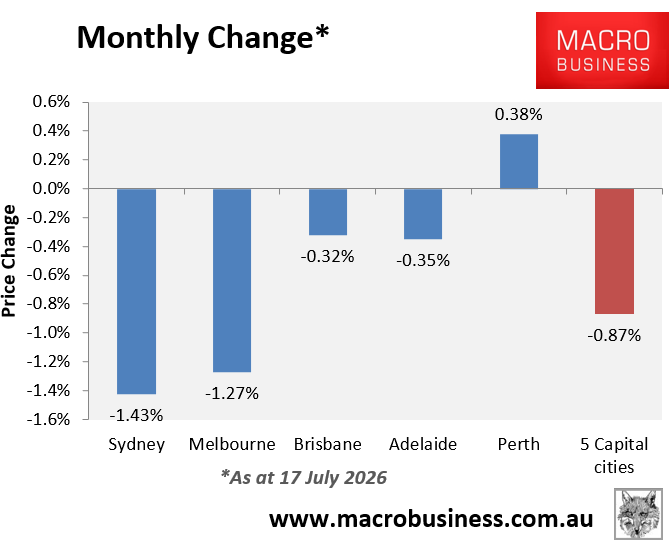
The following chart plots the 28-day change in dwelling values across the five major markets.
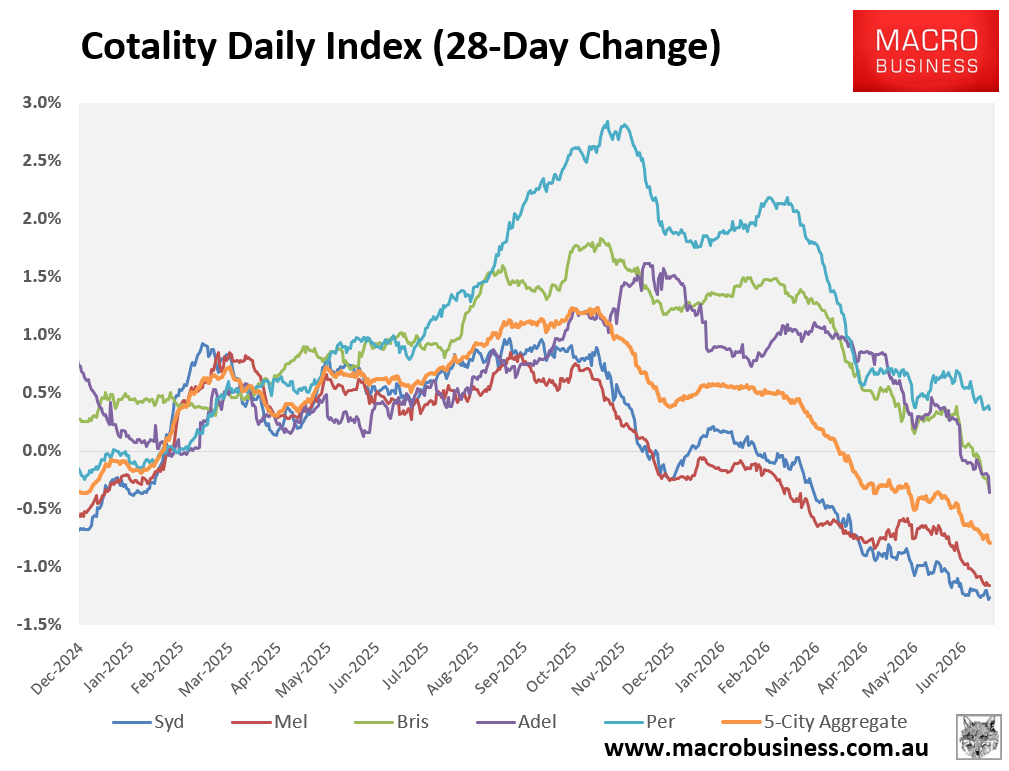
As you can see, the rate of decline has steepened across all major markets except Perth.
Thus, Perth remains the last housing stronghold in what is otherwise a national house price correction.
