The semiconductor bubble is coming under pressure as the war ends. TME with more.
Risk Without Conviction
NASDAQ is back at major resistance, technology volatility continues to scream for attention, leveraged ETF speculation remains extreme, and oil markets have almost completely removed the geopolitical risk premium. From elevated tech volatility to Korea’s AI-fueled leverage boom, speculation remains alive and well. Plenty of movement. Plenty of speculation. Very little conviction.
Overshooting
NDX is back at the massive upper trend line that has defined price action for nearly a decade. Despite the recent turbulence, the index remains roughly 16% above its 200-day moving average, underscoring how extended the longer-term trend still is.
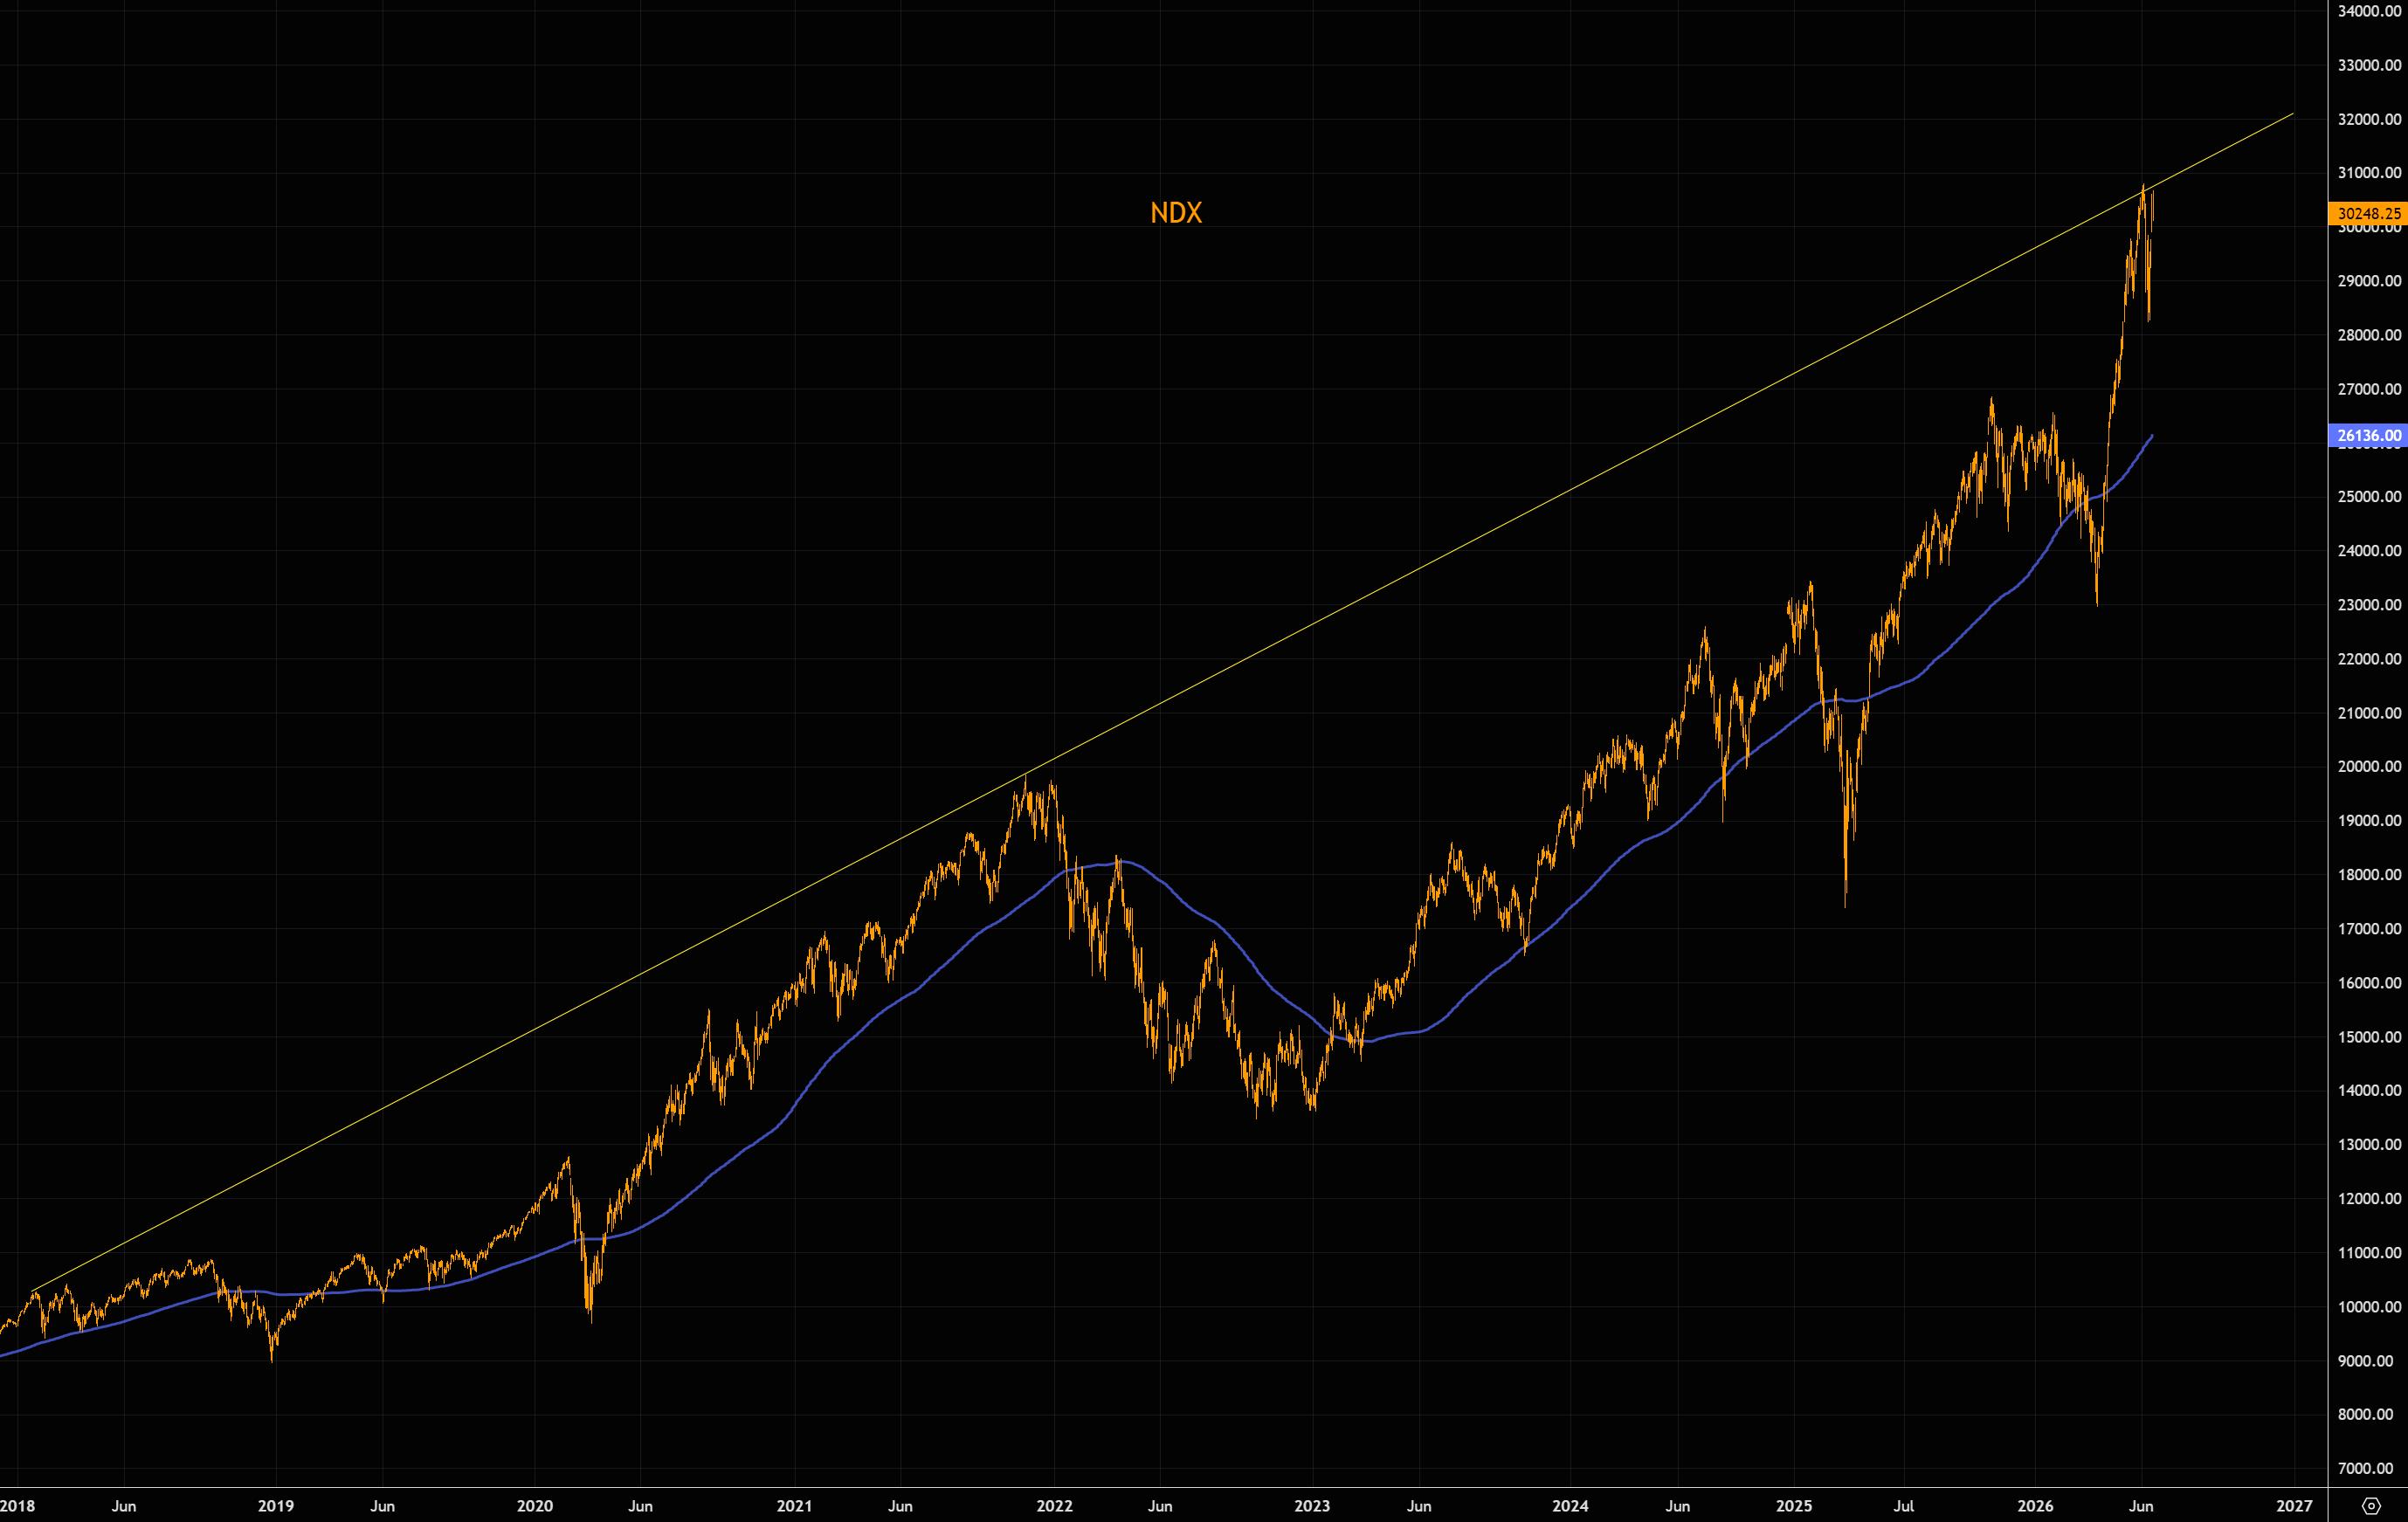
Source: LSEG Workspace
Range mania
NASDAQ bounced on range lows and the 50-day moving average, only to reverse near range highs. Massive moves, but no new direction. In a market like this, chasing breakouts has been one of the most expensive trades around.
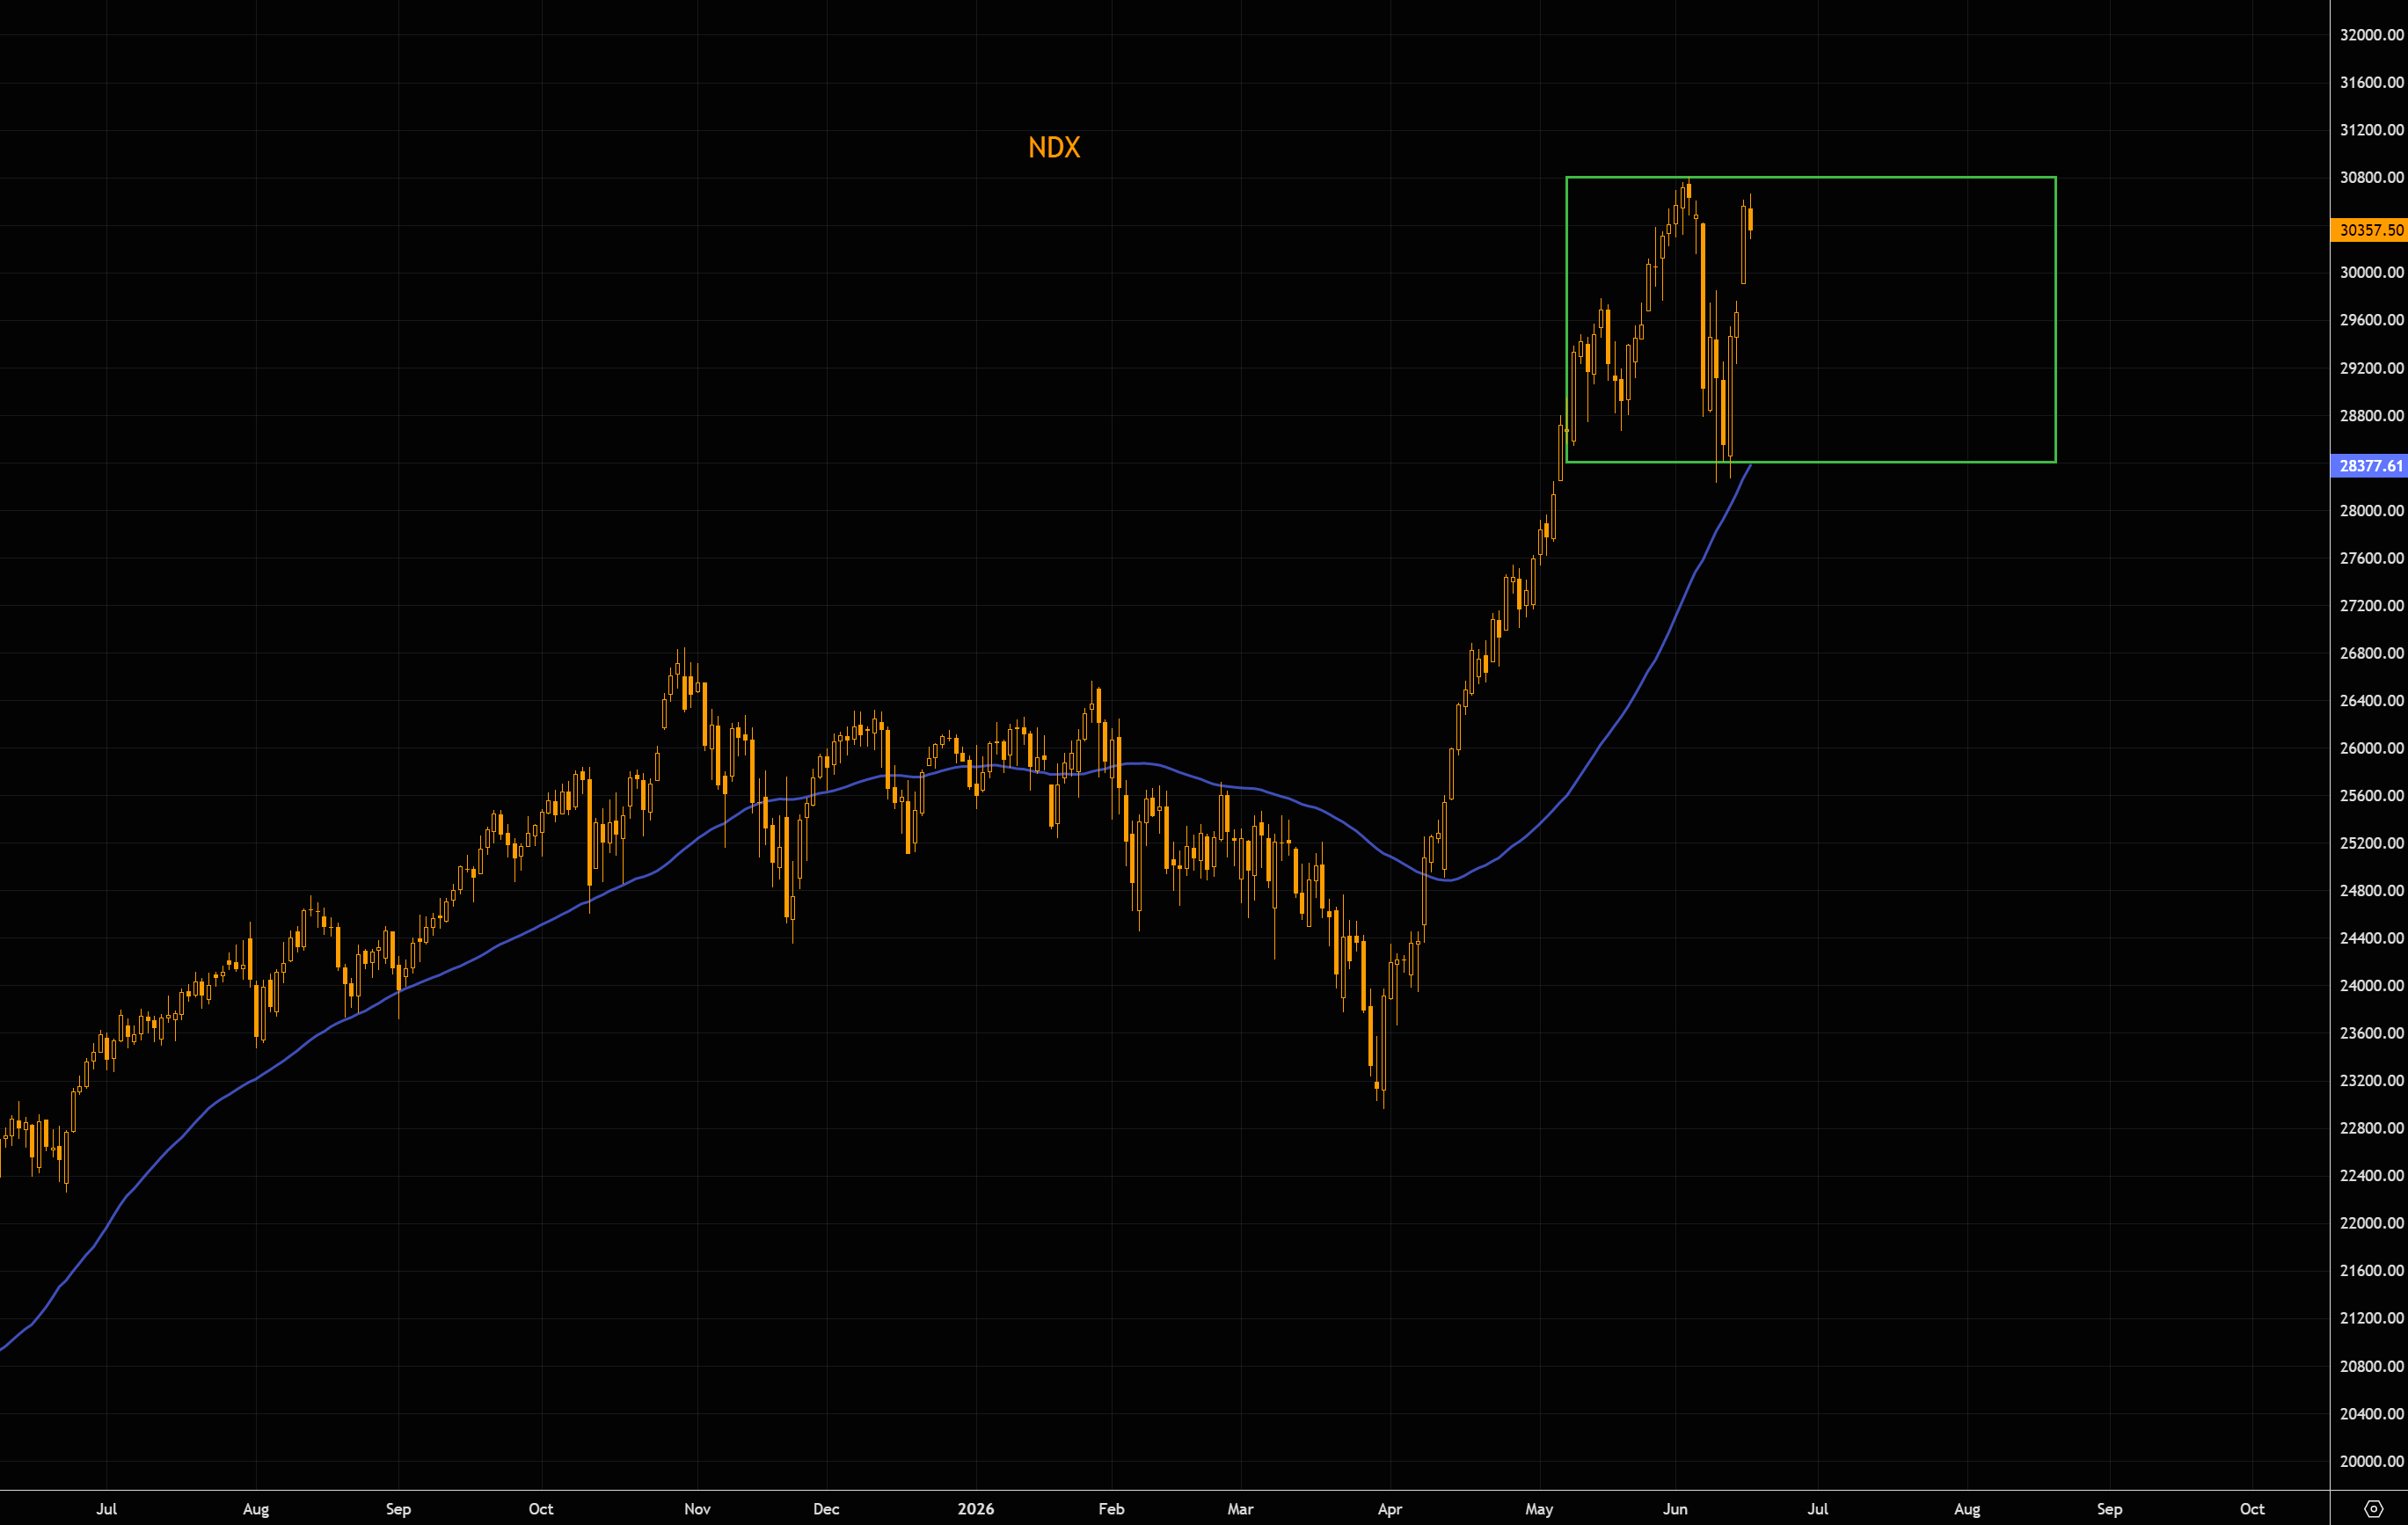
Source: LSEG Workspace
That tech stress
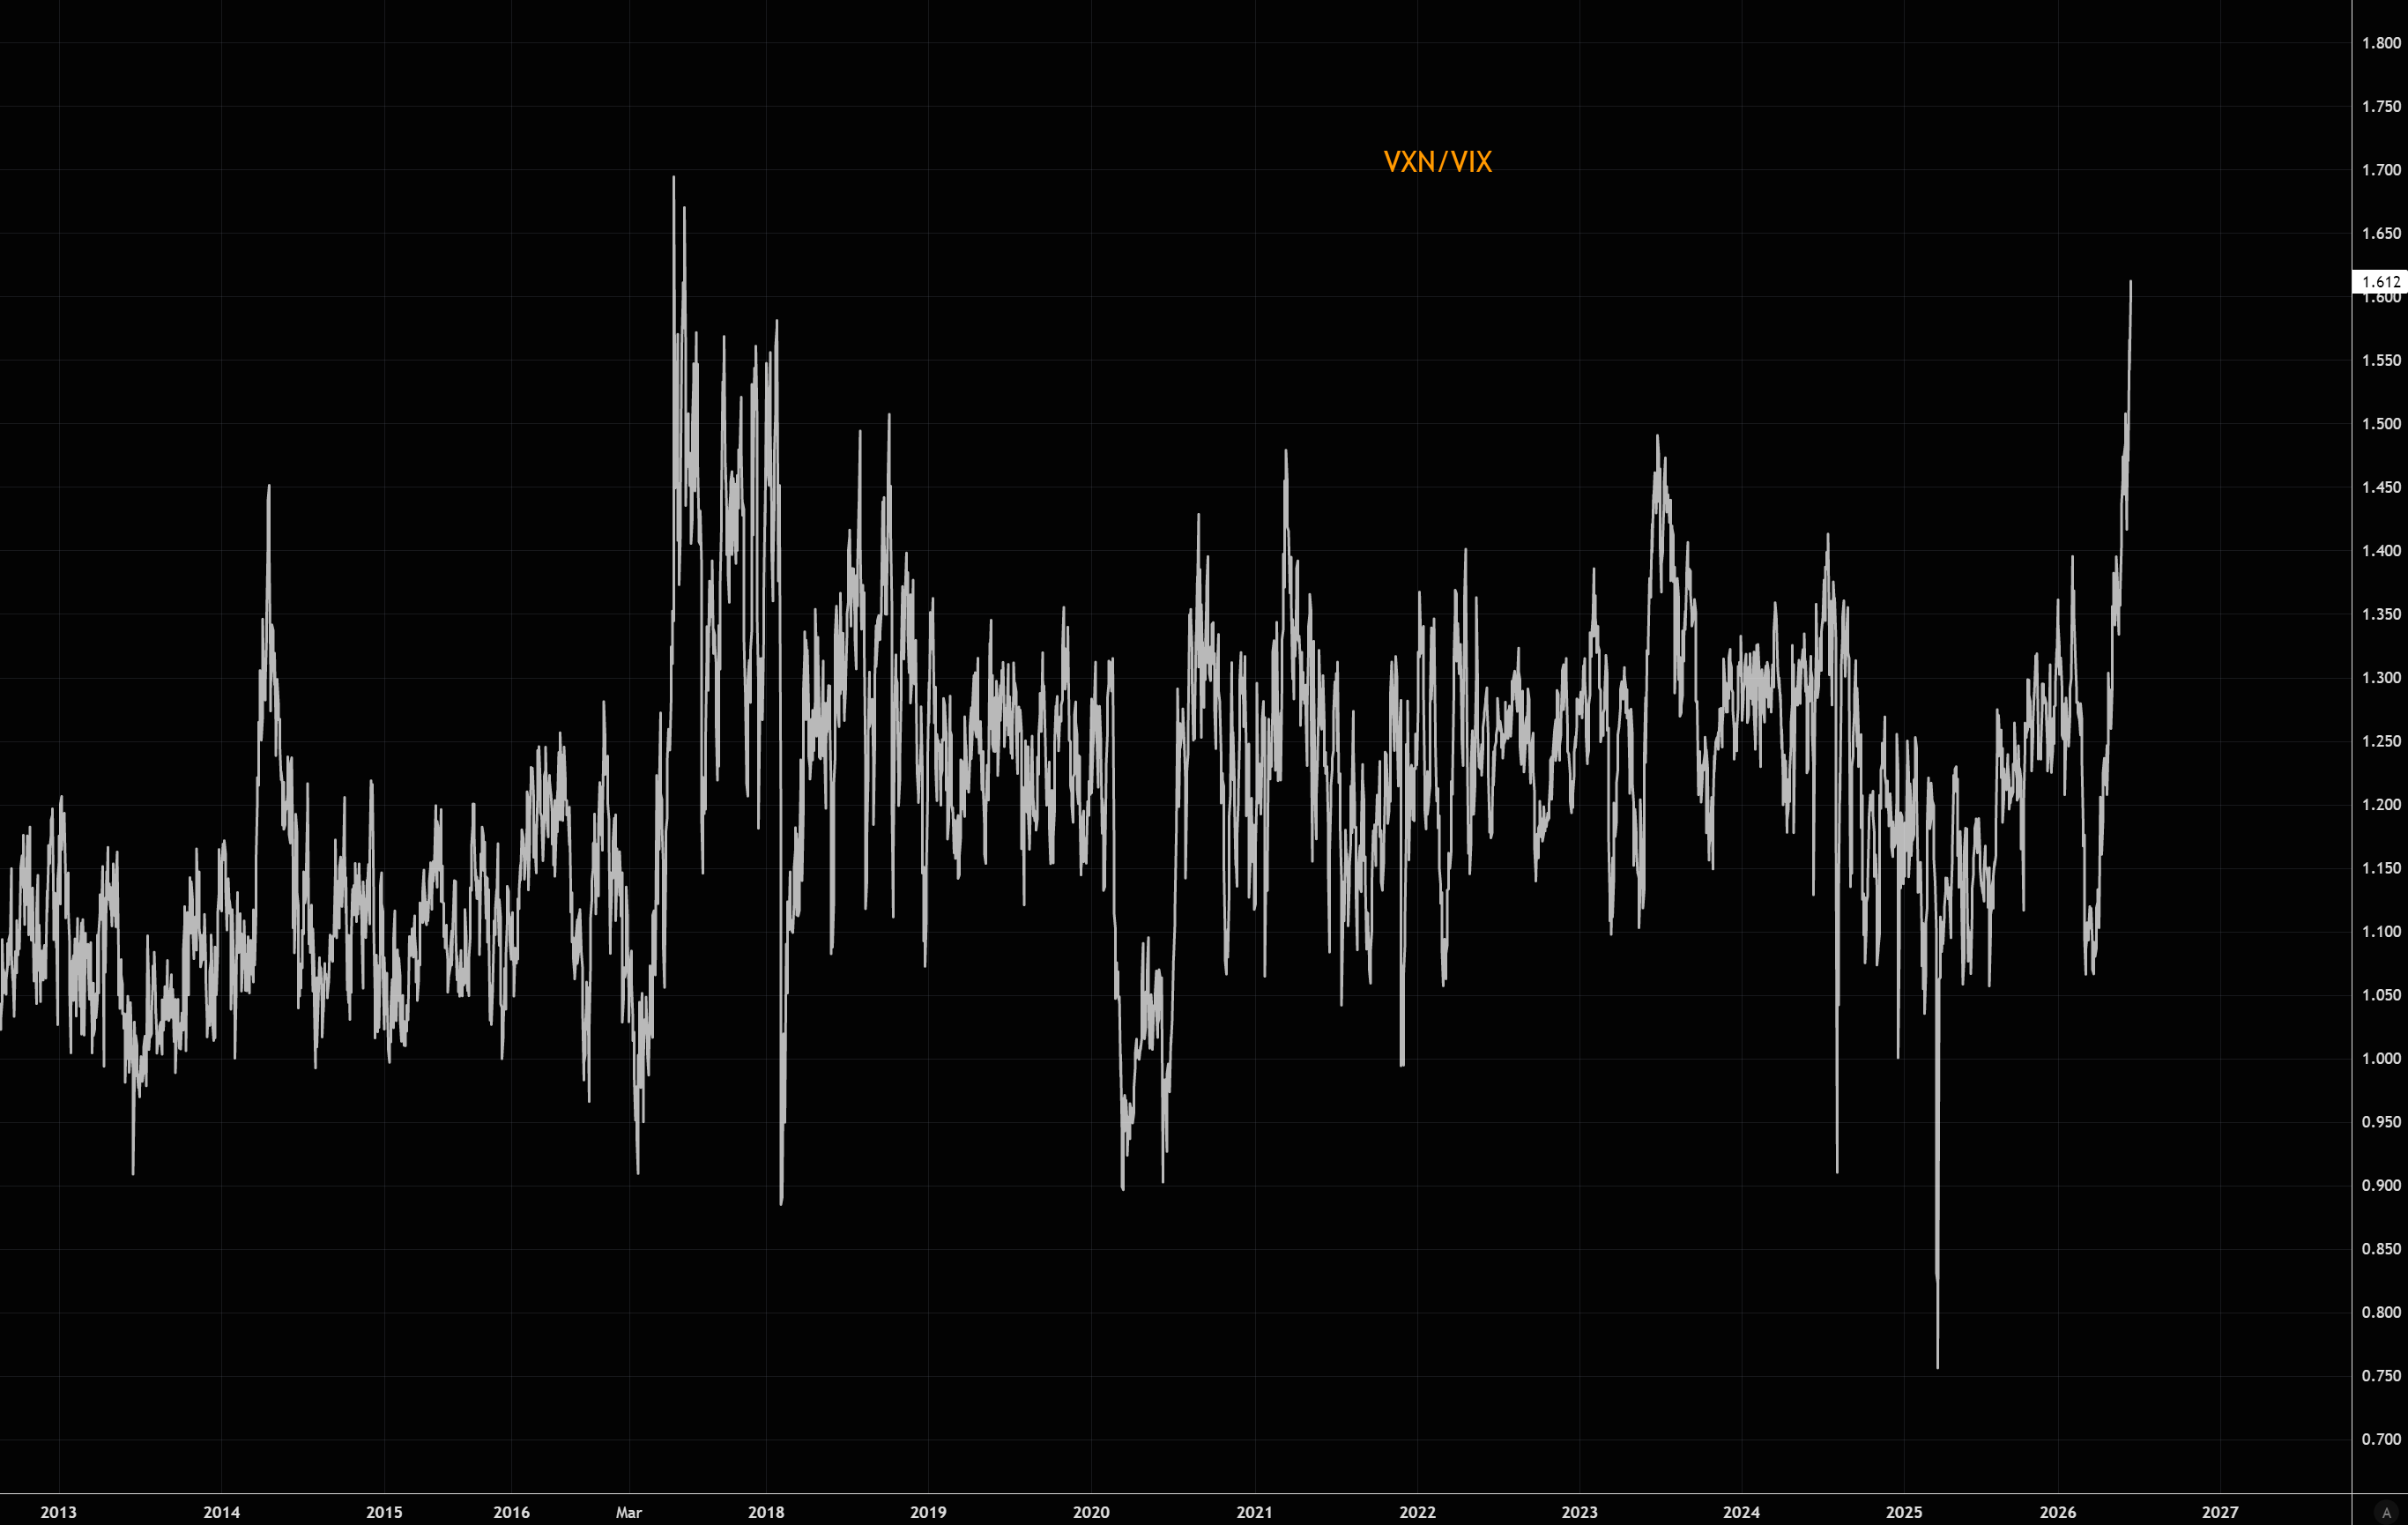
The VXN/VIX spread keeps blowing out. The second chart shows just how dramatic the move has been, with the ratio surging since late March as investors continue to pay up for tech volatility. More here.
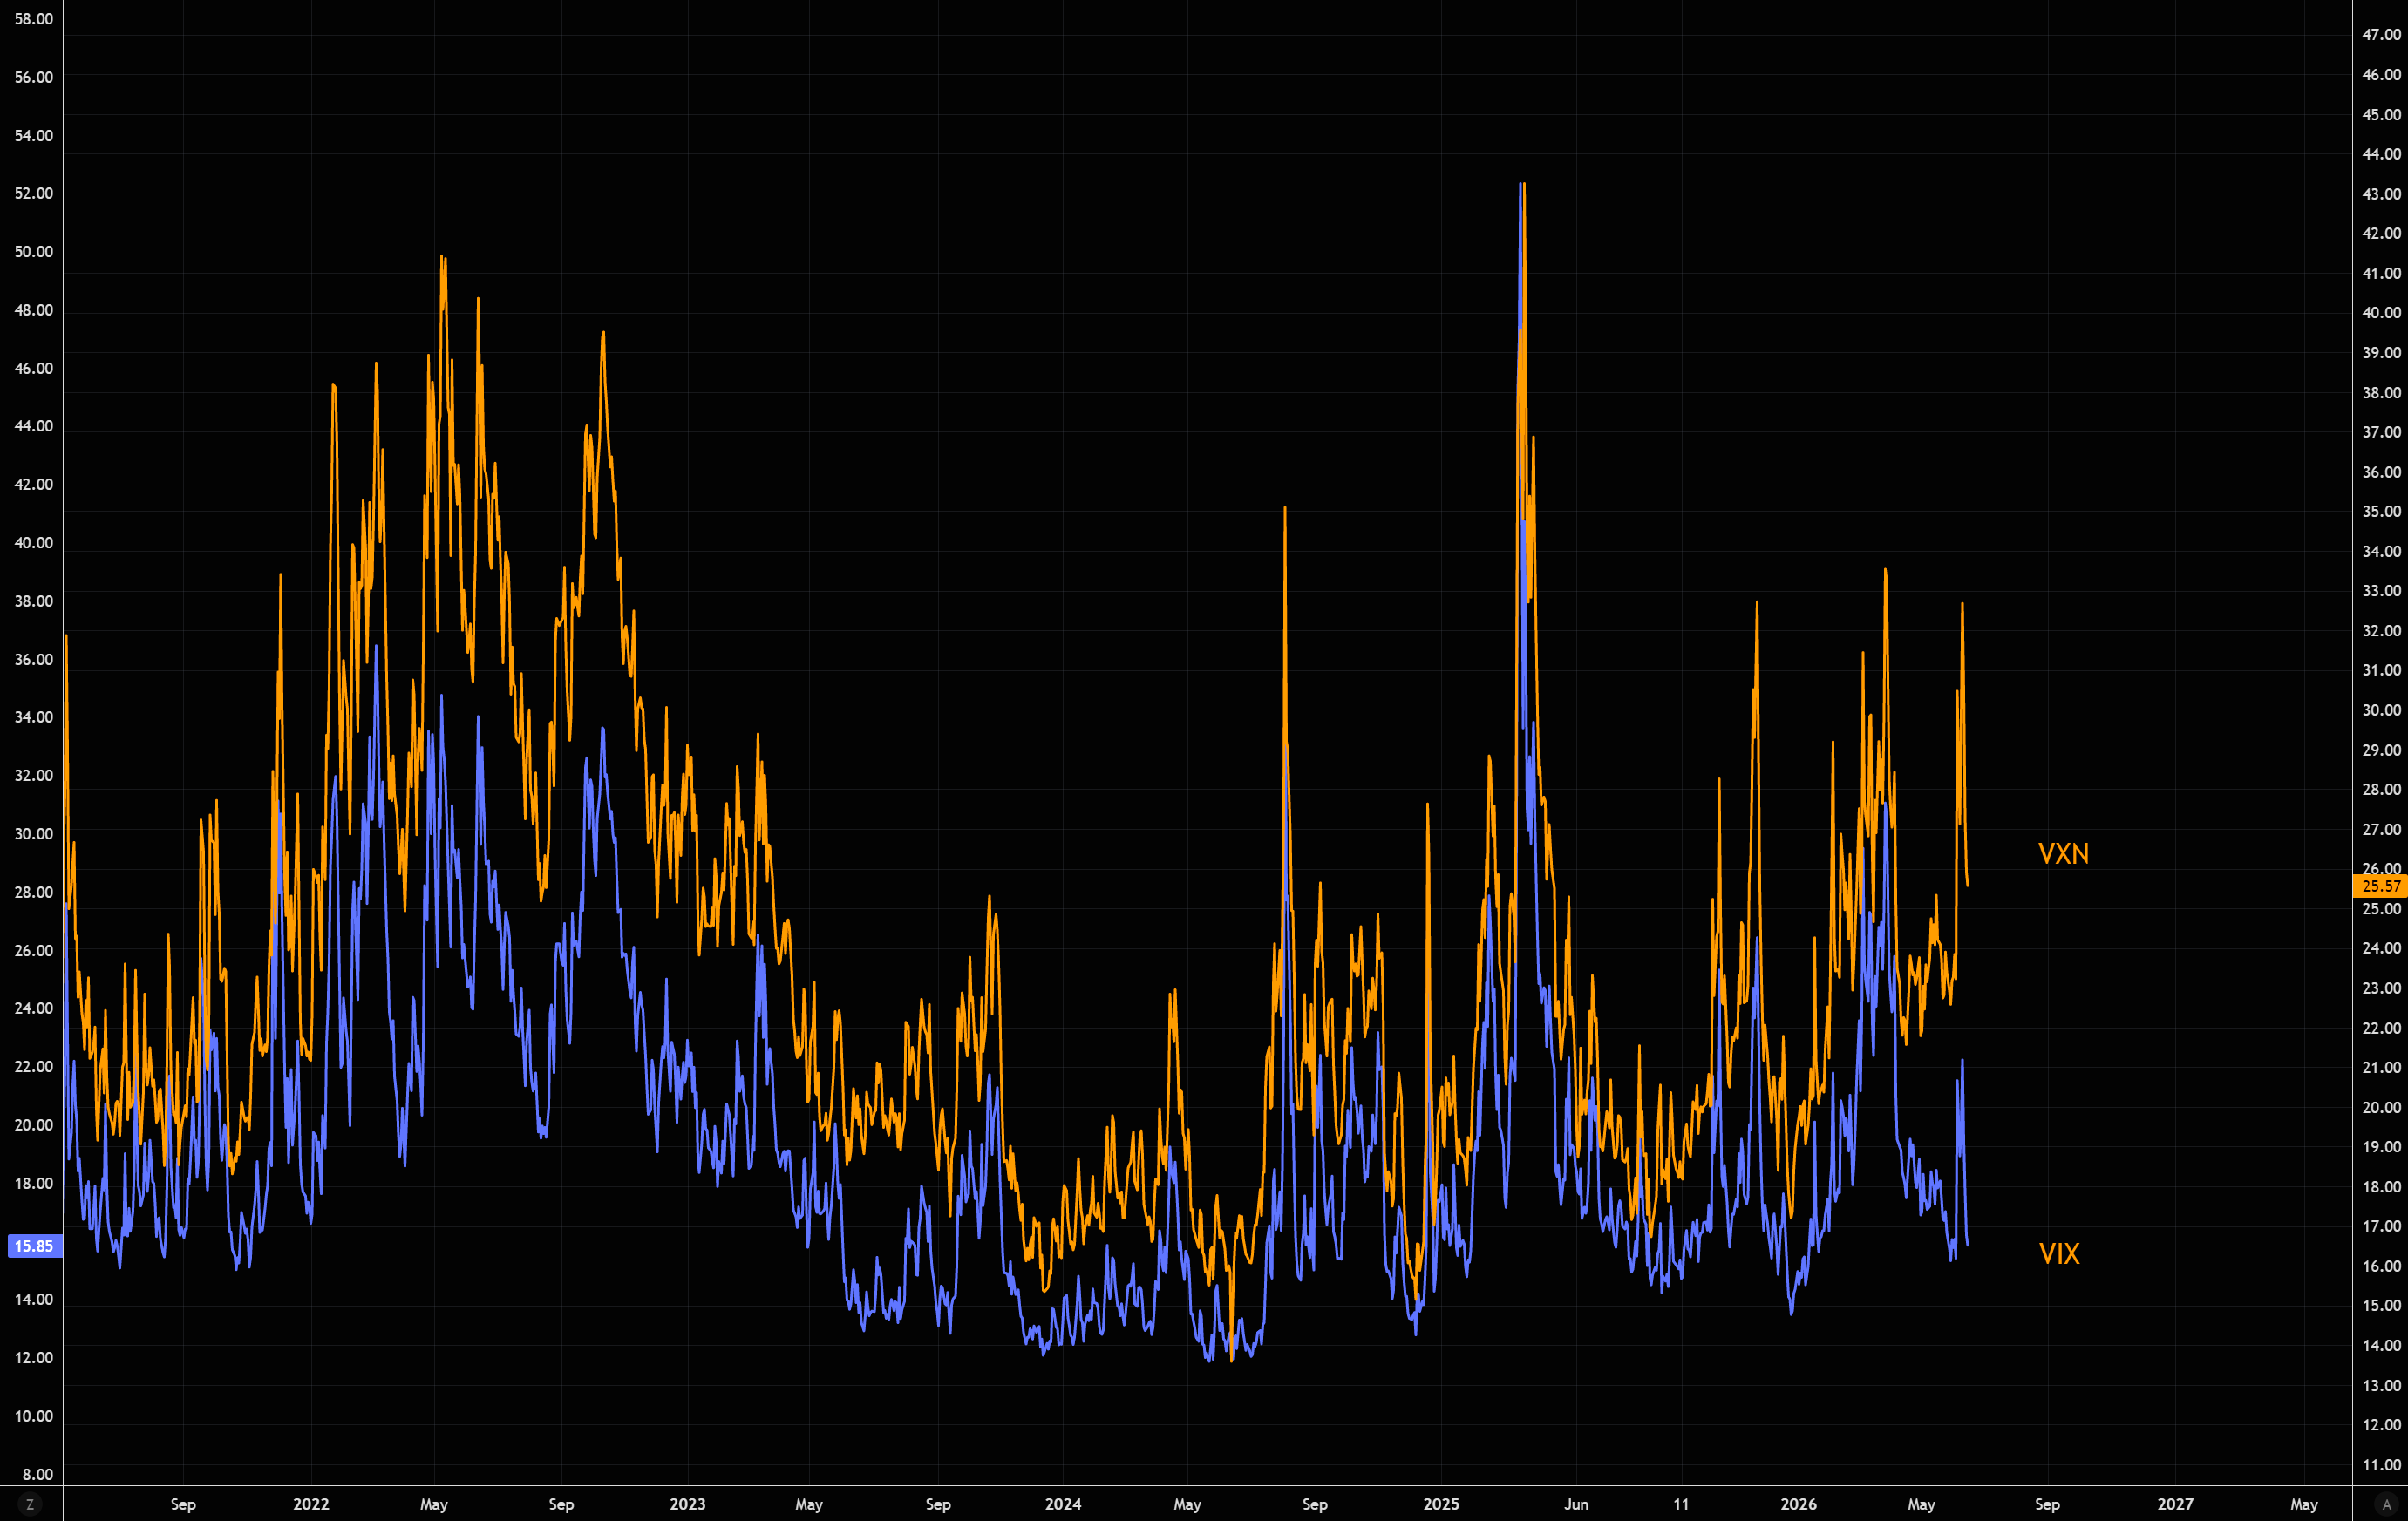
Source: LSEG Workspace
Leverage mania
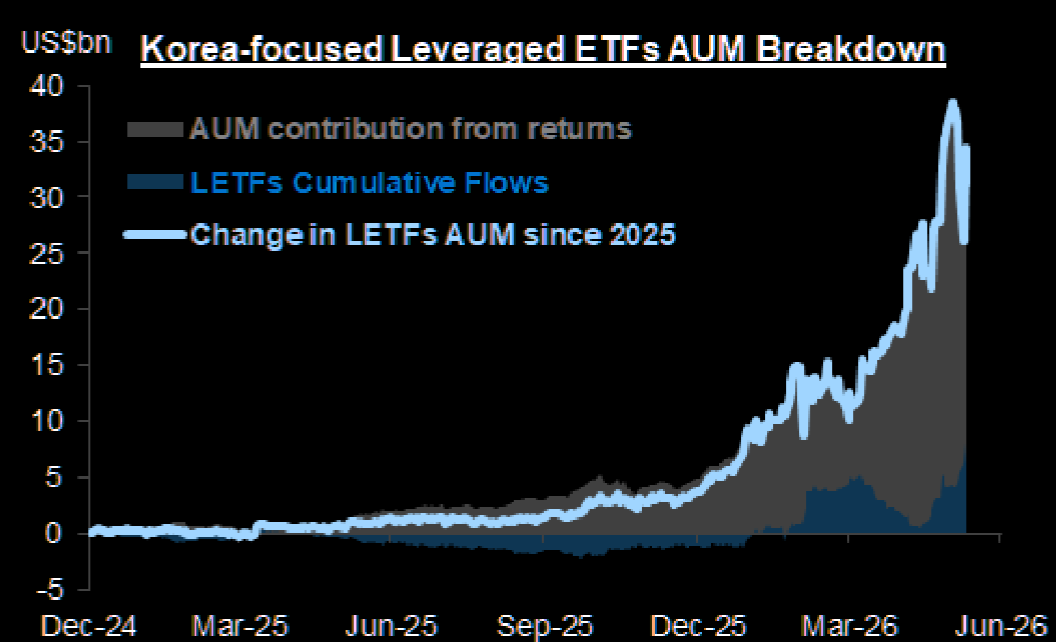
Leveraged ETFs have become a major force in market structure. In Korea, assets invested in leveraged ETF products reached roughly $40 billion at their peak, equivalent to around 2.6% of the market’s free float. When products of this size rebalance, they can have a meaningful impact on both flows and volatility.
The danger is that leveraged ETFs tend to attract momentum-driven capital. As long as prices rise, the feedback loop is supportive. But a larger drawdown can quickly change behavior, turning eager buyers into investors simply hoping to get back to breakeven.
Source: GS
What’s wrong?
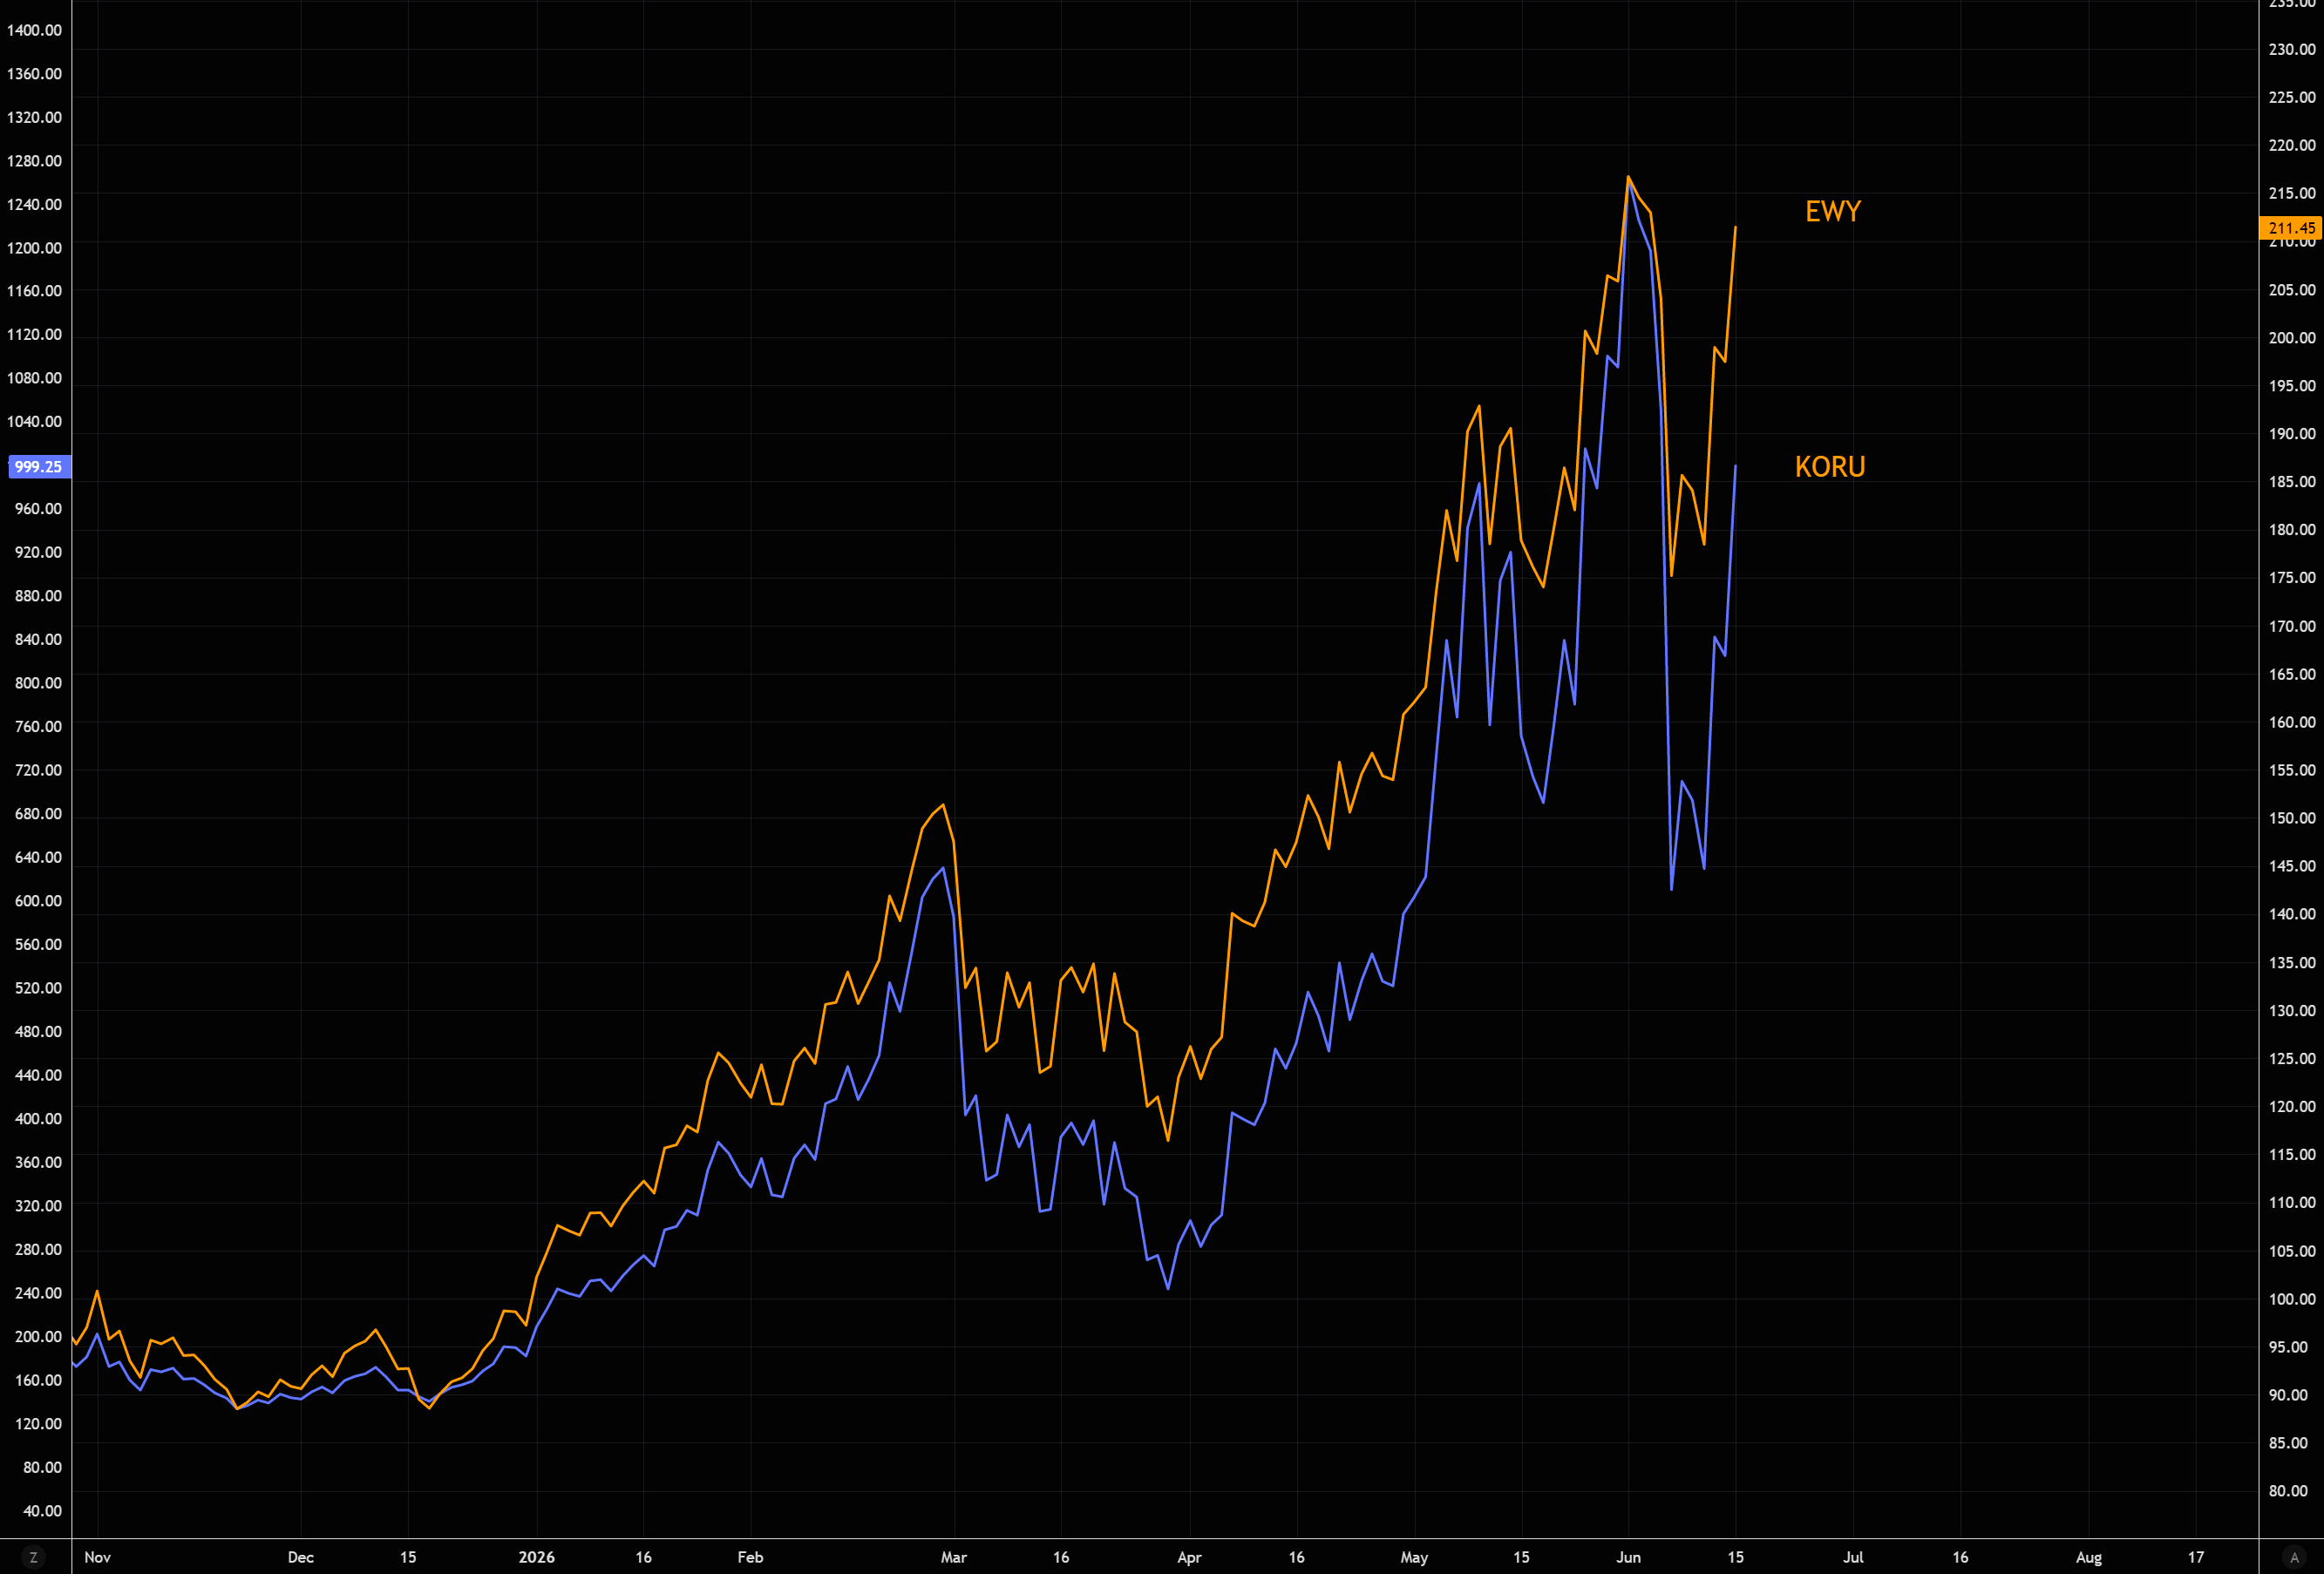
EWY is basically back to ATHs, but the KORU is still way below the ATH print from early June. Most retail don’t understand why their KORU isn’t at highs, but they don’t understand the dynamics of leveraged ETFs and the slippage effect (synthetic short gamma, or as we at TME call it, short gamma, not theta).
Source: LSEG Workspace
Get your slippage
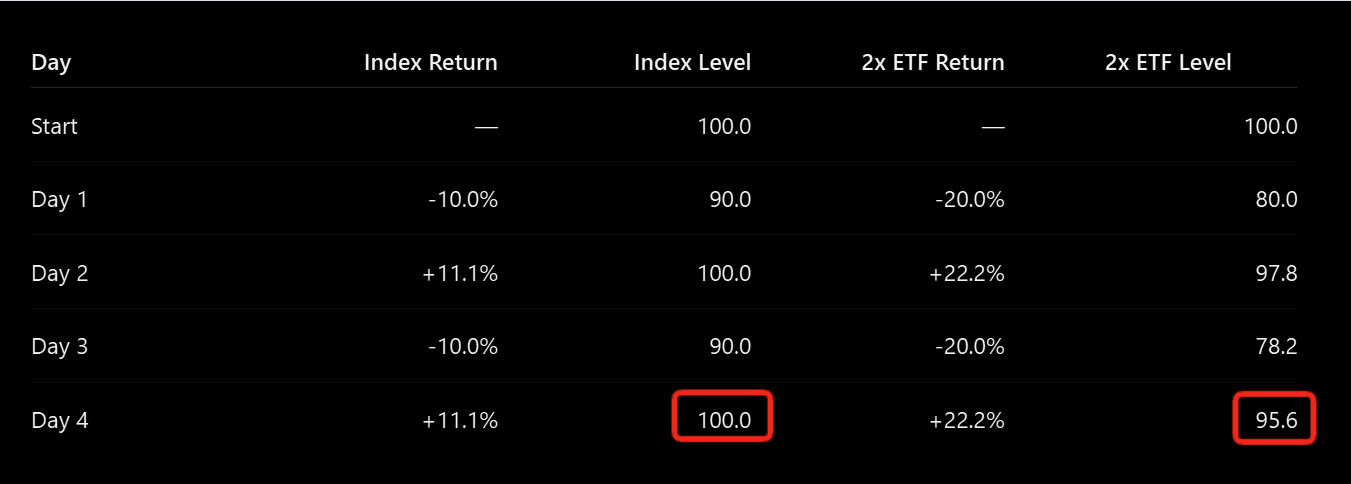
The slippage comes from daily rebalancing. Leveraged ETFs target a multiple of daily returns, not long-term returns. As a result, volatile back-and-forth price action gradually erodes performance through compounding effects, meaning a leveraged ETF can remain well below its highs even when the underlying index has fully recovered. More here.
Source: TME
Retail not roaring
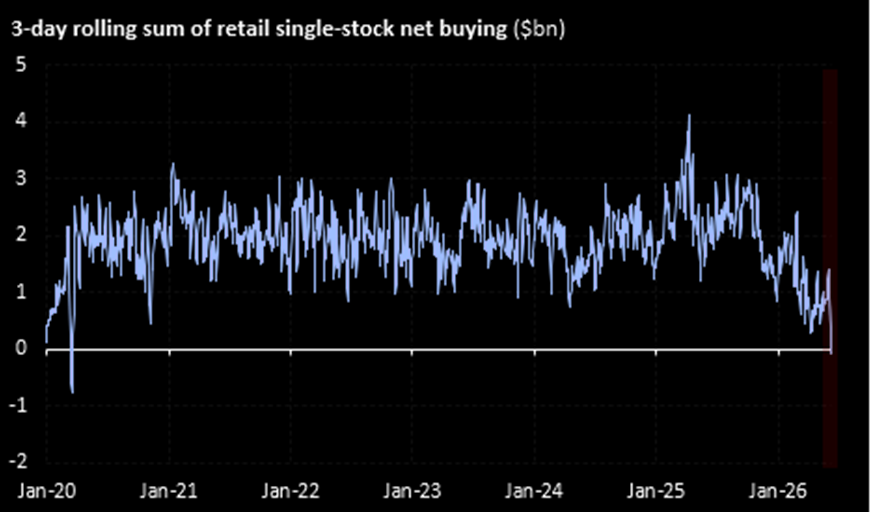
Retail’s single-stock net buying has fallen to the lowest (on a 3-day rolling basis) since COVID. And if you strip out the SpaceX buying from retail over the past two trading days, there was not much more buying across the rest of the market. More on who is actually buying this market here.
Source: Kevin Gordon
Oil vol
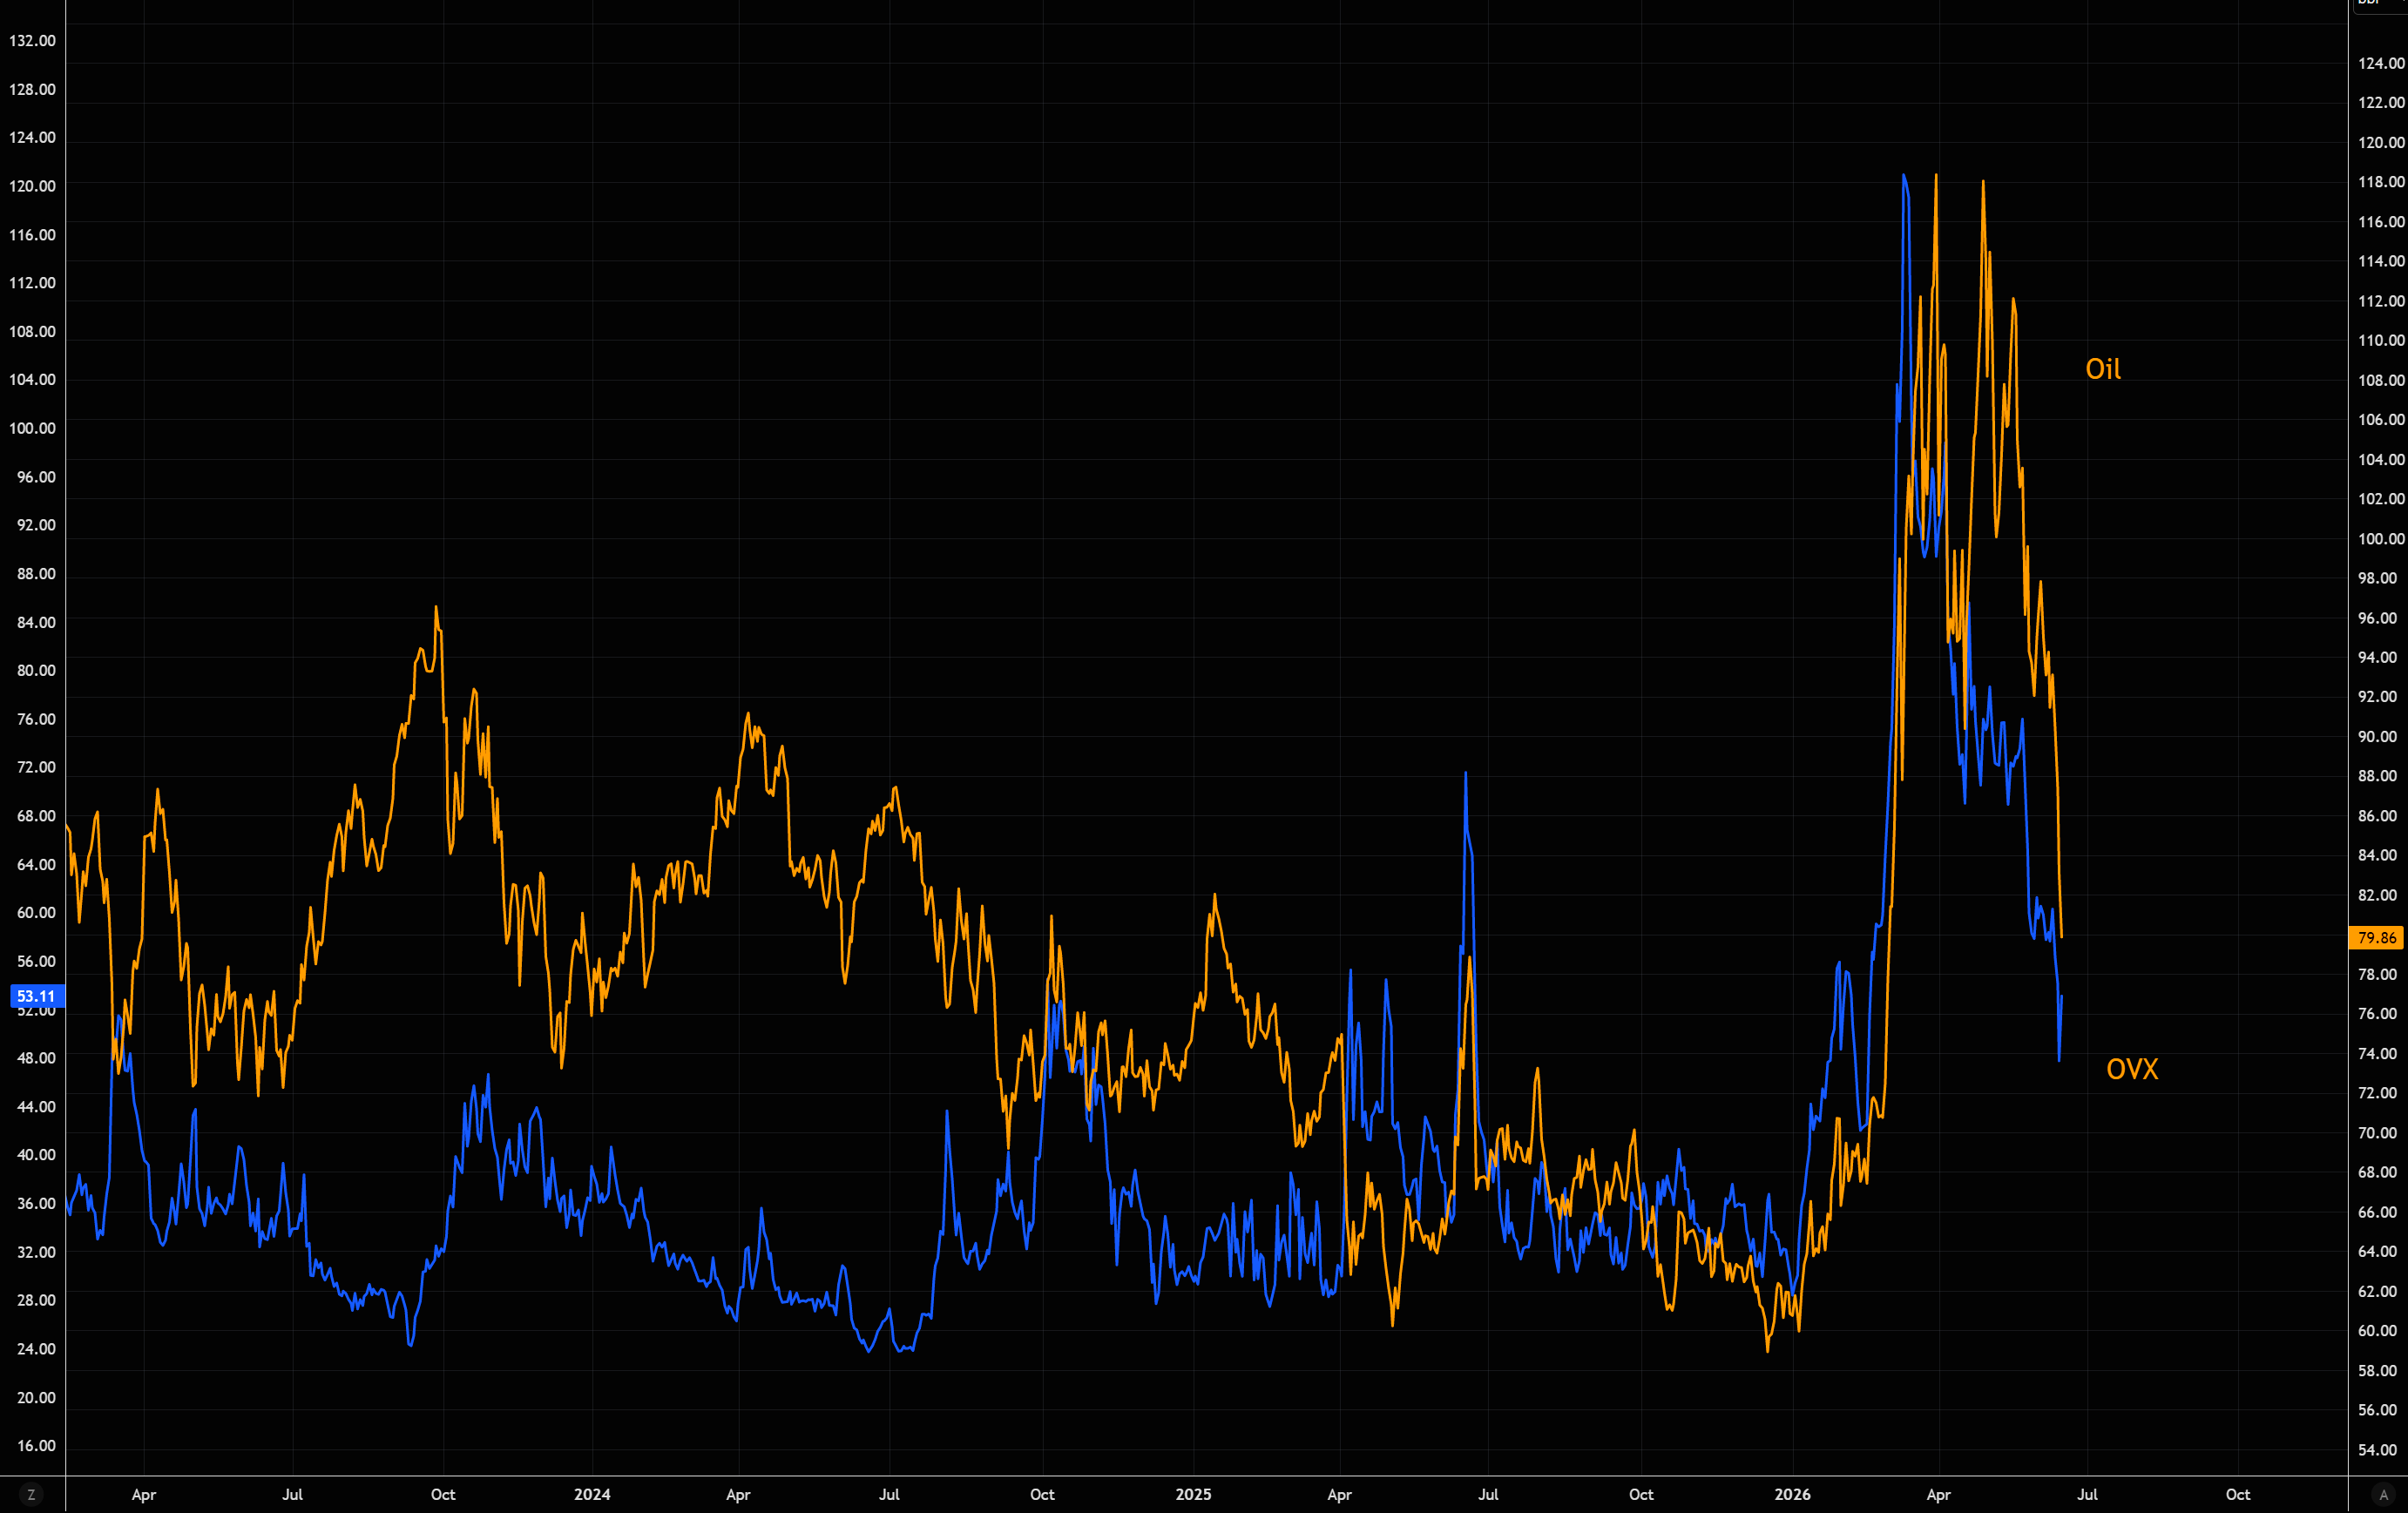
OVX has almost completely round-tripped the war spike, trading back near pre-conflict levels. Markets have aggressively removed geopolitical risk premium, even though the region remains far from calm.
Volatility is not screamingly cheap, but it offers a relatively inexpensive way to express a directional oil view or simply own gamma should tensions escalate again.
Source: LSEG Workspace
Price the oil option
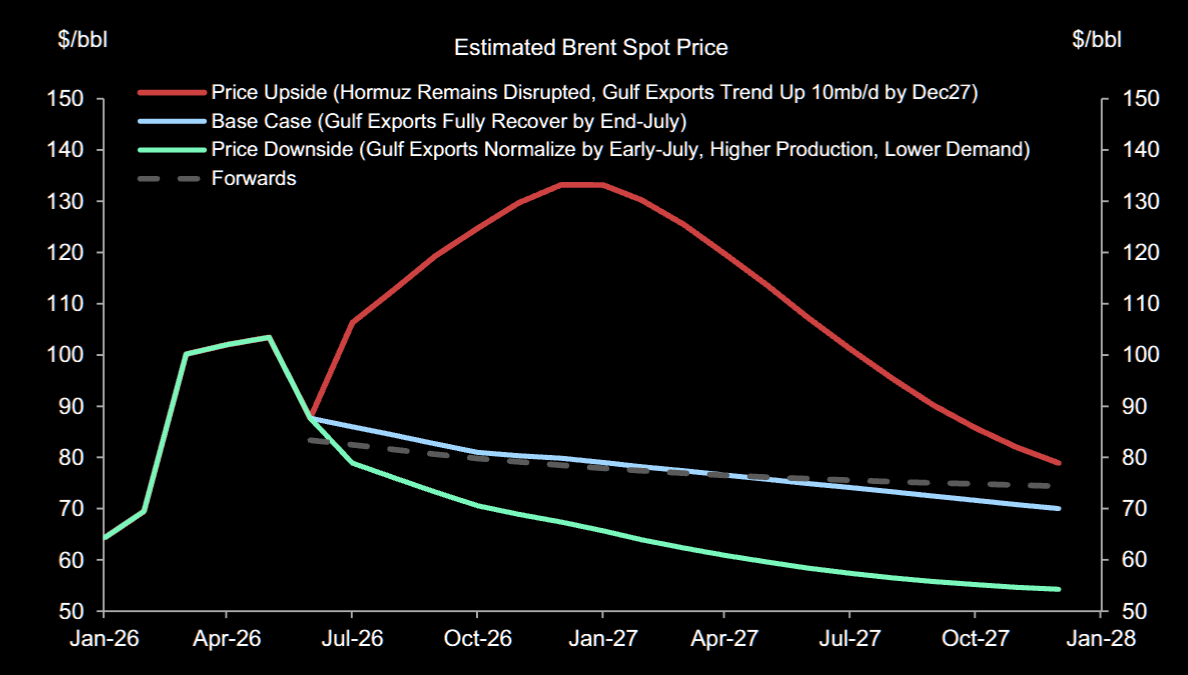
In a bullish scenario involving prolonged Hormuz disruptions, Brent could trade above $130 and average roughly $105 in 2027. In a bearish scenario where exports normalize rapidly and supply improves, Brent could average closer to $60 according to GS.
How do you price that? The question is not whether either scenario is possible. The question is what probability to assign to each. With downside appearing relatively limited while geopolitical tail risks remain substantial, oil increasingly resembles an option where the distribution of outcomes matters more than the base case. More on oil here.
Source: GS
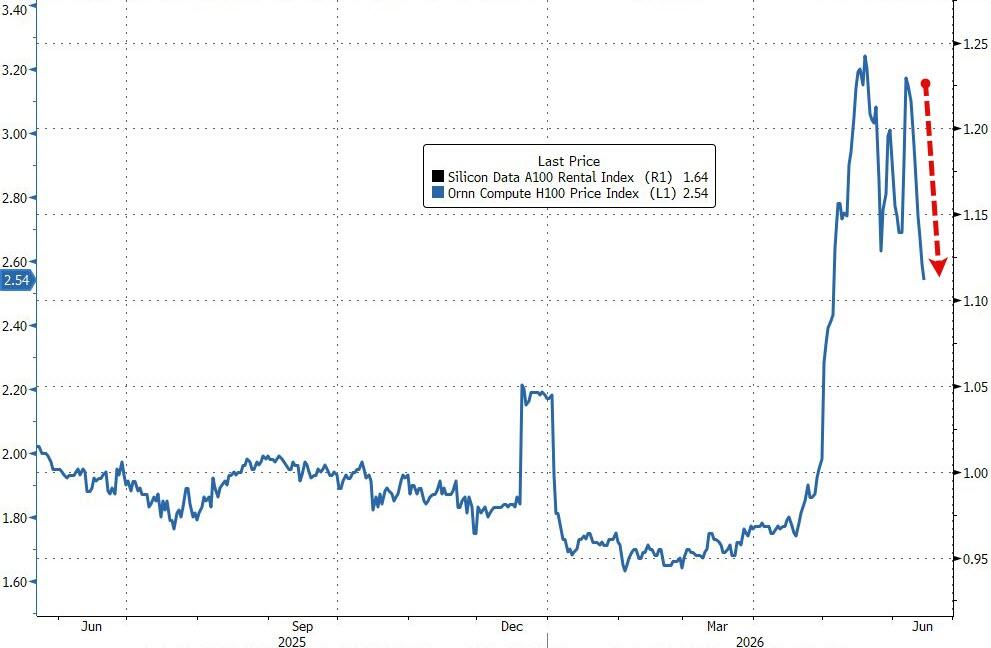
The question is, has the semiconductor bubble shot its wad? The war gave everyone an excuse for supply-side shortages, real or imagined. Now stories are popping up everywhere that semis are pumping and hyperscalers are baulking at prices. If “compute scarcity” goes, the whole market goes with it.
Goldman points out that the leading indicator of computational rental is sliding.
With token spend, which is basically what it costs to run AI per unit of output;
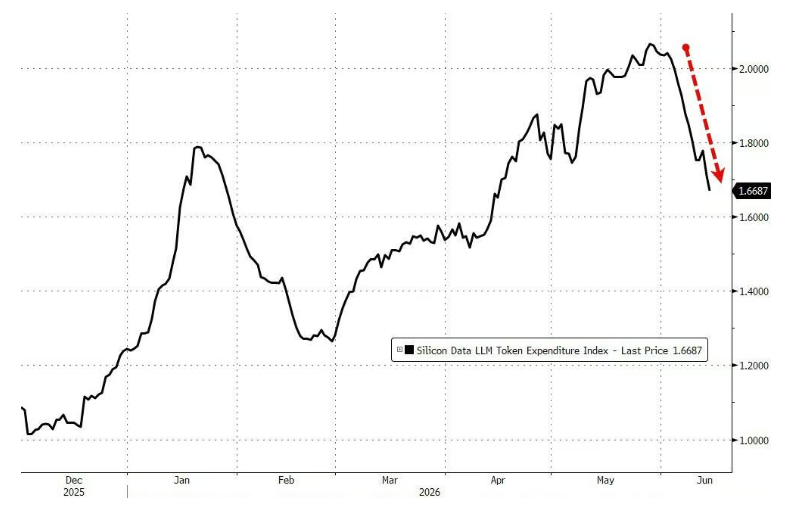
That is, supply is catching up to demand, one way or another.
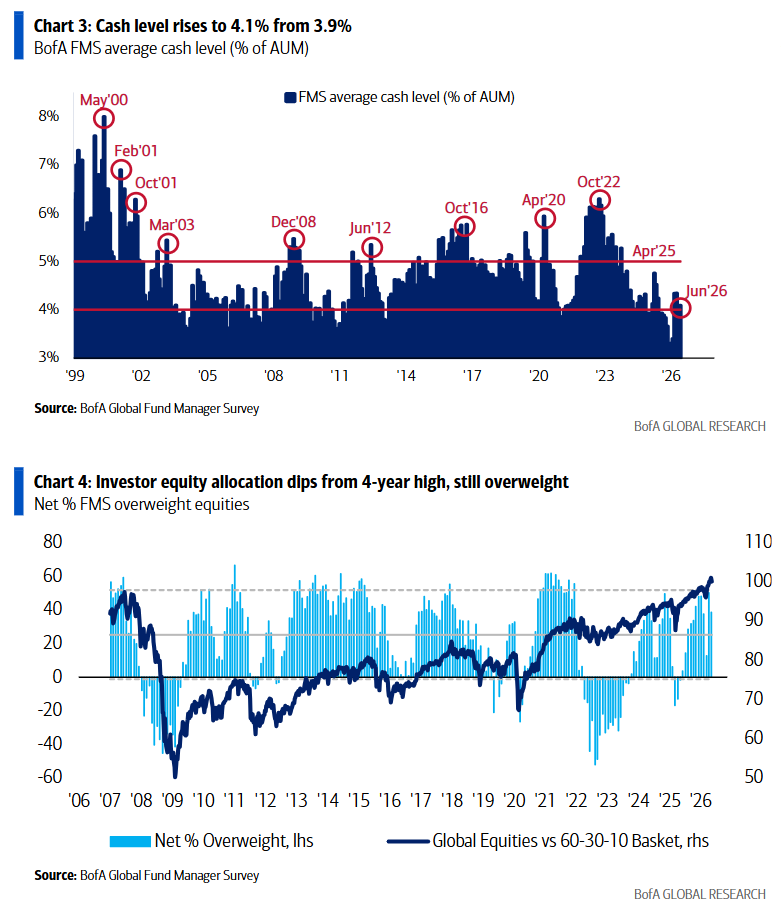
The BofA fundie survey is still way long.
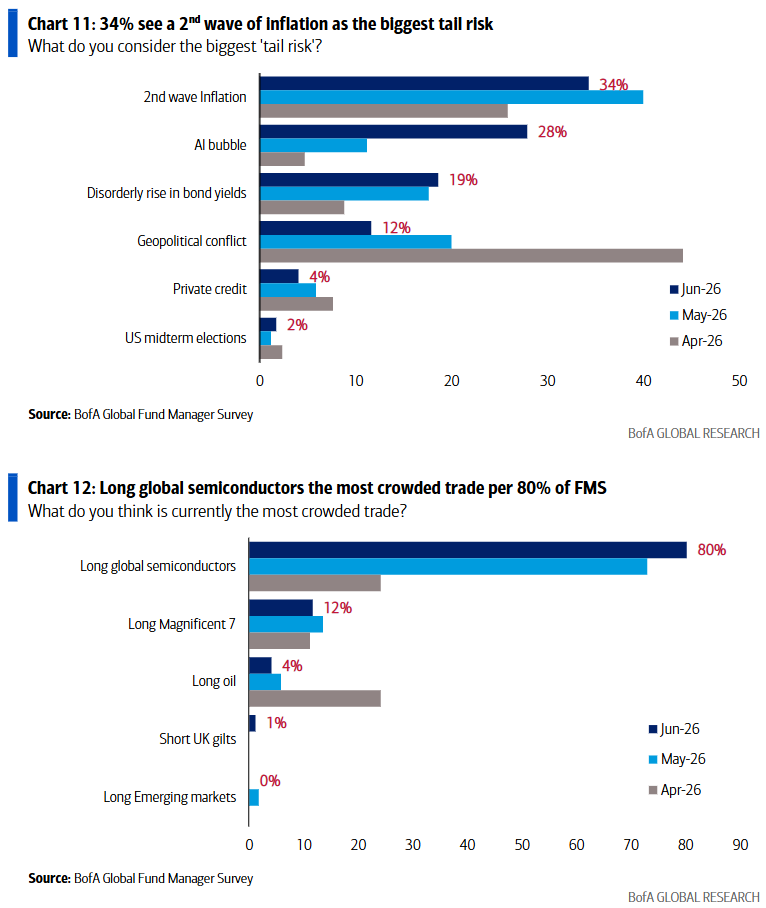
- Risk & Allocation Shifts: Top tail risks: “2nd wave inflation” (34%) and “AI bubble” (28%); FMS trimmed global equity OW to 38% (from 50%), tech OW to 26% (from 33%), shifting to long bonds, Europe, consumer, REITs while shorting commodities, semis, materials, banks.
- Fed Policy Outlook: 40% expect rate hikes in next 12 months (vs. 16% in May), 55% anticipate “dovish hold” (vs. 33% “hawkish hold” at FOMC), signaling tightening bias impacting bond/credit markets.
- Cash Levels at Historic Low: FMS cash rose to 4.1% of AUM (from 3.9%), remaining at historic low, indicating constrained liquidity for capital deployment.
- Equity Allocation Dip: Net equity allocation fell to 38% (from 50% in May), marking defensive shift after 4-year high; US equity overweight dropped to 17% (from 20%).
- Crowded Trade & Risk Concentration: Long global semiconductors at 80% (record high crowded trade); AI bubble risk at 28% (up from 16% in May), signaling elevated correction risk for tech assets.
- Stagflation Expectations Shift: 58% expect “stagflation” (down from 69% last month), indicating reduced pessimism despite 45% predicting higher CPI.
- Tail Risk Repositioning: Geopolitical conflict risk collapsed to 12% (from 44%), while “2nd wave inflation” dominates (34%), driving sector rotation away from tech and toward inflation-sensitive assets.
Semis have driven all of the recent substantial earnings upgrades. If that deflates, bend over and place your head firmly between your legs.
