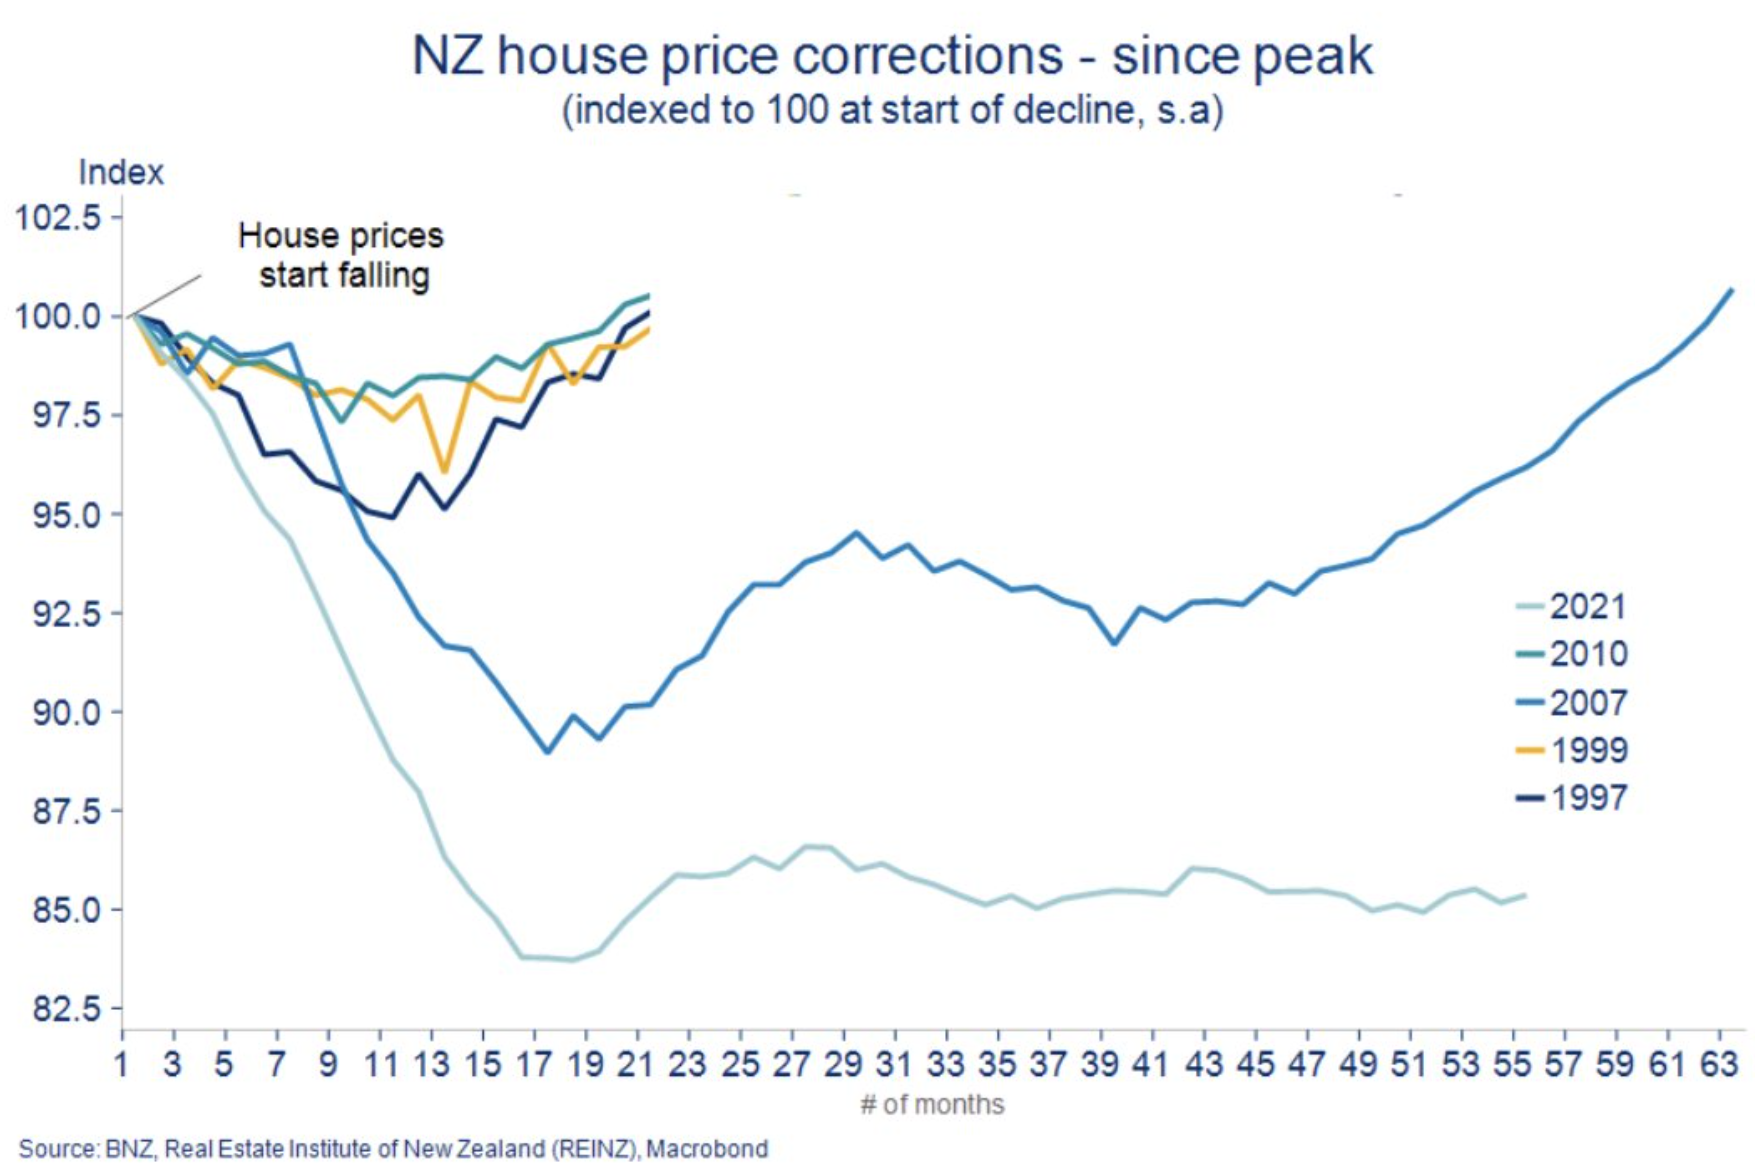
Dr Cameron Murray posted the following chart on Twitter (X) showing New Zealand’s “stunning” house price correction, which has lasted more than four years:
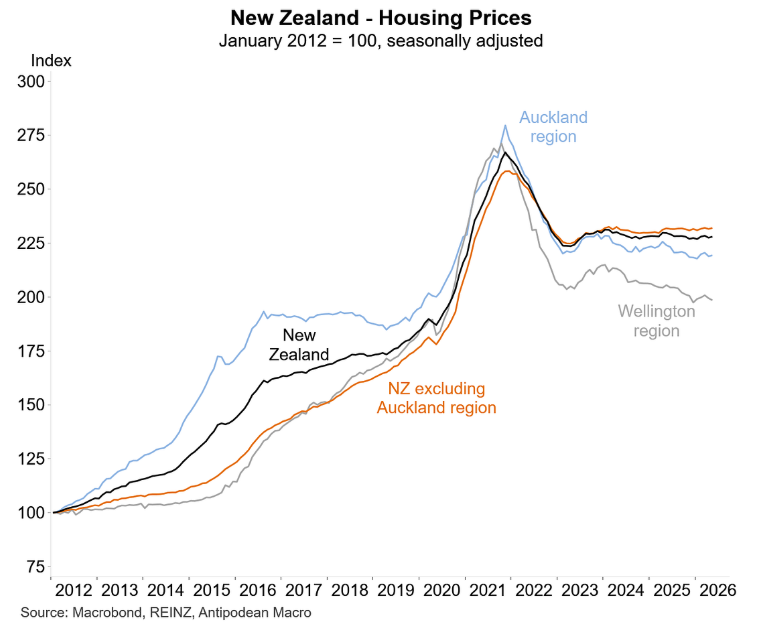
The following chart from Justin Fabo from Antipodian Macro shows that New Zealand’s house price correction has impacted all major markets, which have each experienced serious price falls:
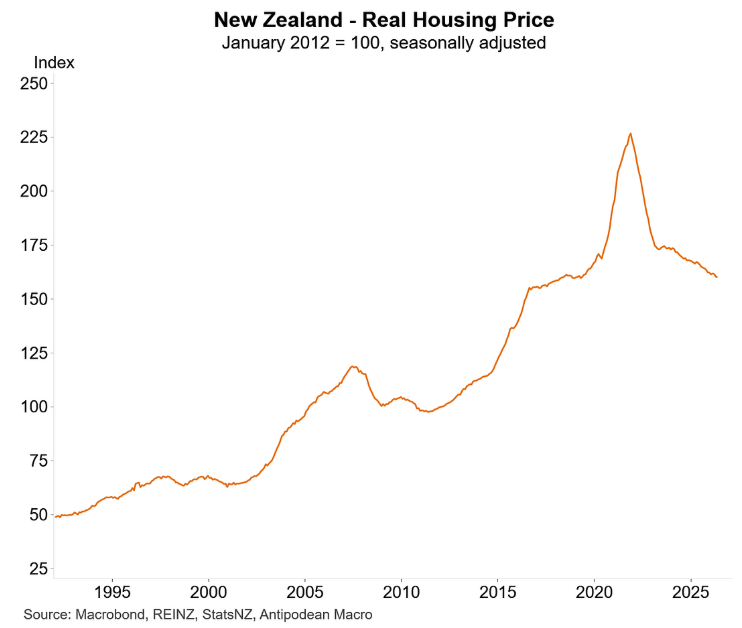
When adjusted for inflation, New Zealand real house prices have “crashed” by around 30%, taking values back to 2019 levels:
As noted by Dr Murray below, Cotality data shows that New Zealand first home buyers are benefiting from the more affordable market, with their share of property purchases surging to at least 20-year highs:
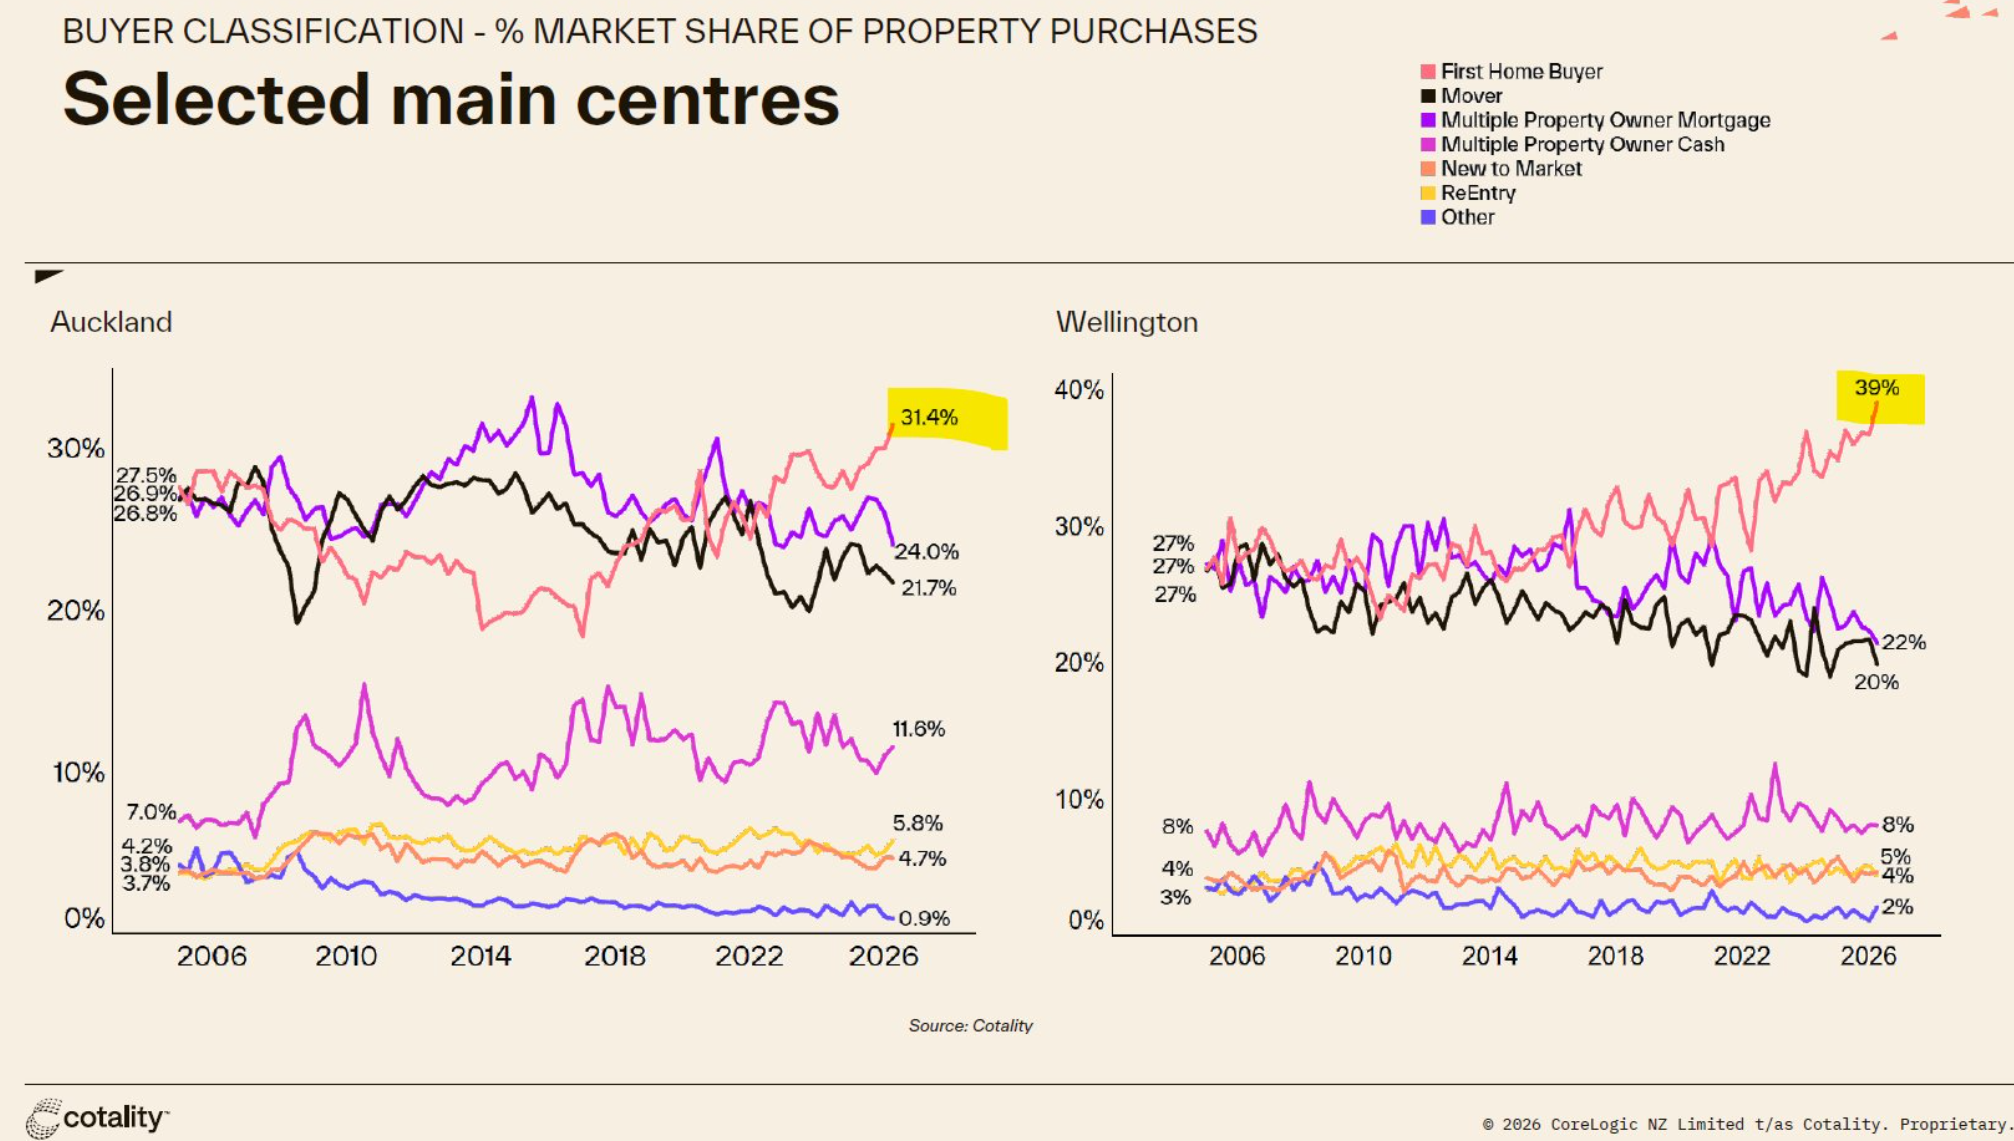
Source: Cotality
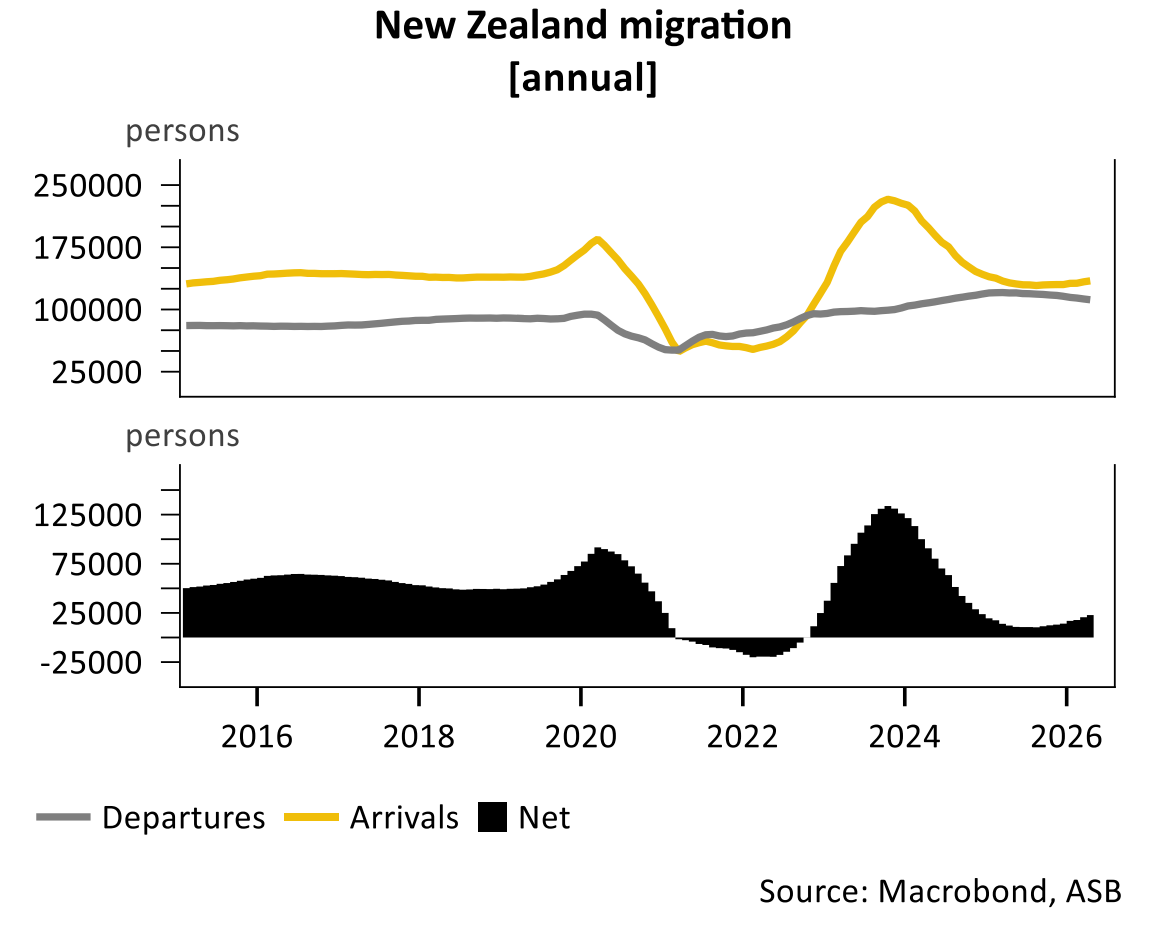
New Zealand’s sharp decline in net overseas migration, which is tracking at historically low levels way below the post-pandemic peak, has also reduced rents.
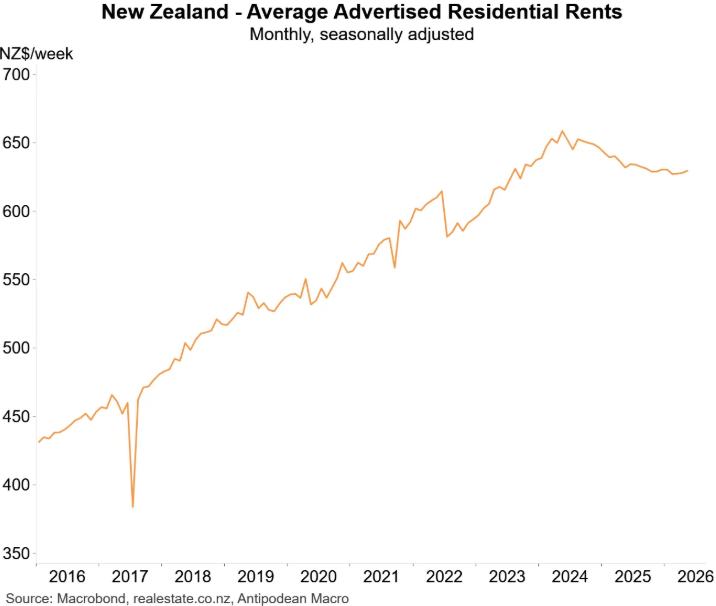
As Justin Fabo shows below, advertised rents in New Zealand have been falling since 2024:
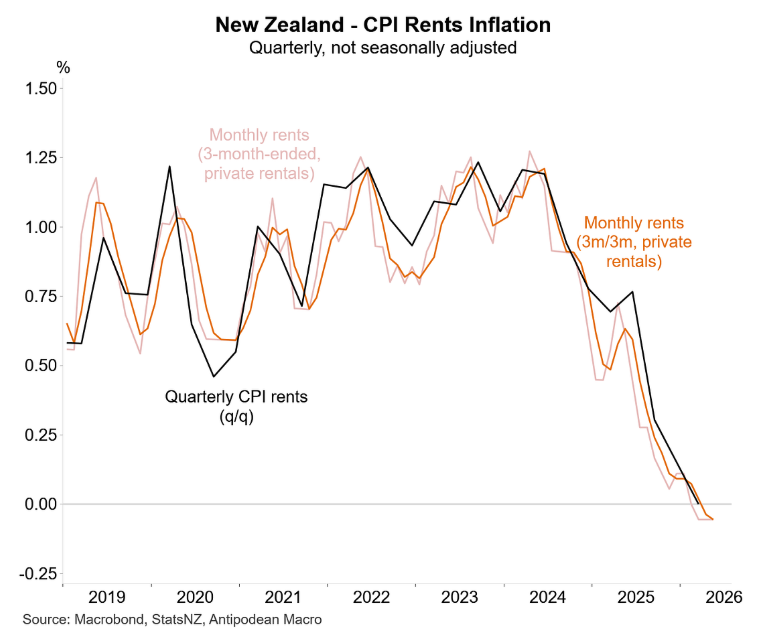
Rents as measured in the CPI have also posted negative growth, helping to lower overall underlying inflation:
The New Zealand government has allowed the property market to deflate, making it more affordable for buyers and renters.
In contrast, the Australian government has actively supported home prices through demand-side stimulatory policies such as the Albanese government’s 5% deposit scheme for first-time home buyers, the expansion of the Help-to-Buy shared equity scheme, and changes to lending rules that prohibit banks from including student debts in loan serviceability assessments.
It has also driven up rents and prices via ongoing high immigration.
Australia has actively added demand-side fuel to the housing market, whereas New Zealand has not.
