Leading independent economist Gerard Minack produced the following chart last year showing that population growth is a major contributor to house price growth across global housing markets:
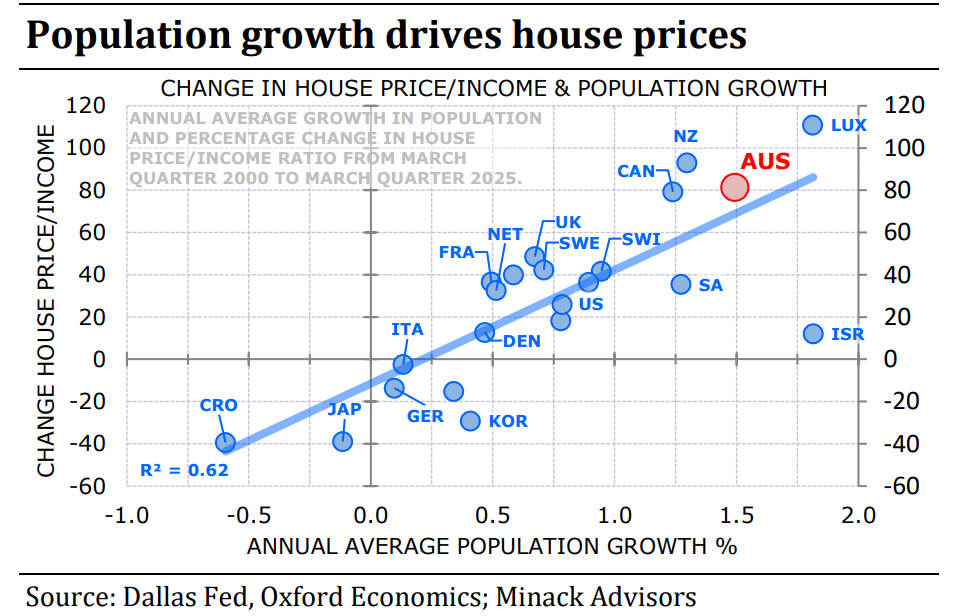
“I am gobsmacked by how many people don’t accept the obvious point that population growth has been a contributor – probably the single most important contributor – to Australia’s high house prices”, Minack wrote.
Australia’s housing market has experienced two-speed growth since the onset of the COVID-19 pandemic in March 2020:
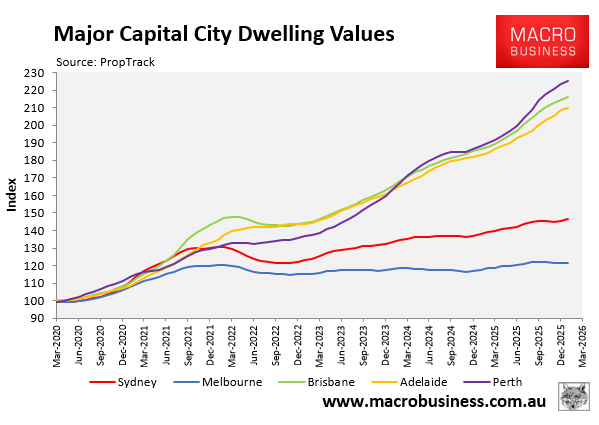
As illustrated by PropTrack above, home prices in Brisbane (116%), Perth (125%), and Adelaide (110%) have more than doubled since March 2020, whereas Sydney (46%) and Melbourne (22%) have experienced far slower growth.
I recently argued that the divergence in population growth from the pre-pandemic trend helps explain the divergence in dwelling value growth.
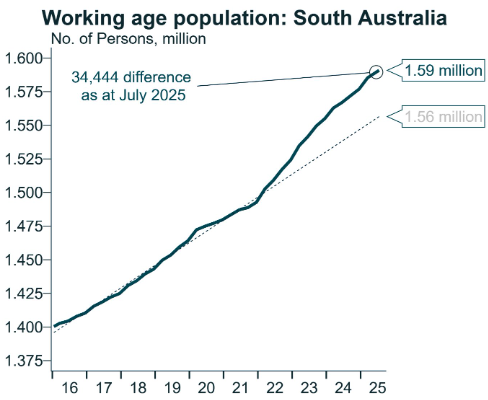
As illustrated by Alex Joiner from IFM Investors last year, population growth in Queensland, Western Australia, and South Australia has been significantly stronger than the pre-pandemic trend:
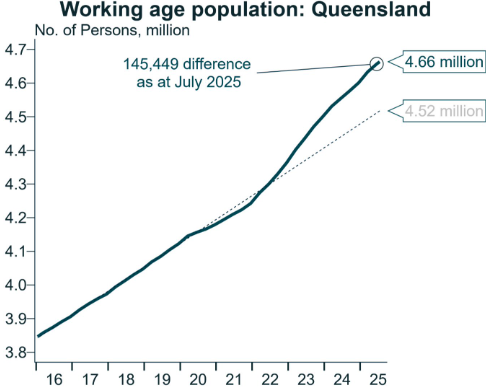
Source: Alex Joiner (IFM Investors)
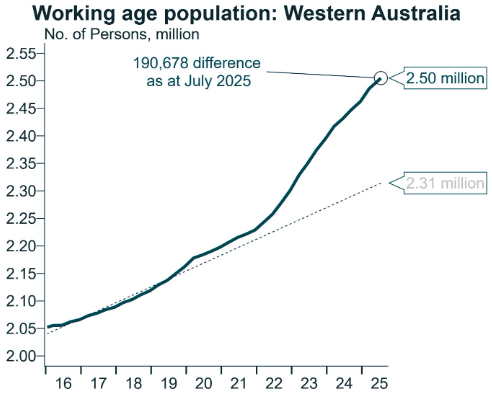
Source: Alex Joiner (IFM Investors)
Source: Alex Joiner (IFM Investors)
In contrast, New South Wales’ population growth has roughly matched the pre-pandemic trend:
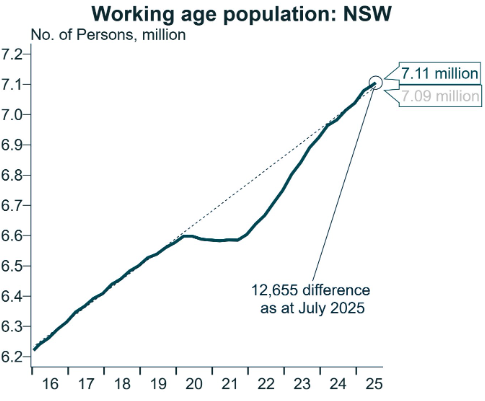
Source: Alex Joiner (IFM Investors)
Whereas population growth in Victoria has been well below the pre-pandemic trend:
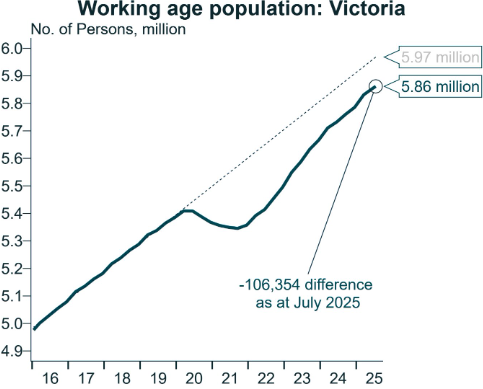
Source: Alex Joiner (IFM Investors)
New research from CBA has confirmed my findings.
“This divergence in price performance across states can largely be explained by different trends for population growth and construction activity”, noted CBA economists Trent Saunders and Belinda Allen.
“Without exception, the states that have seen population growth outstrip construction activity are the same states that have recorded the largest price gains over the past six years”.
The chart below from CBA tracks perfectly with the differences in dwelling value growth since the beginning of the COVID-19 pandemic:
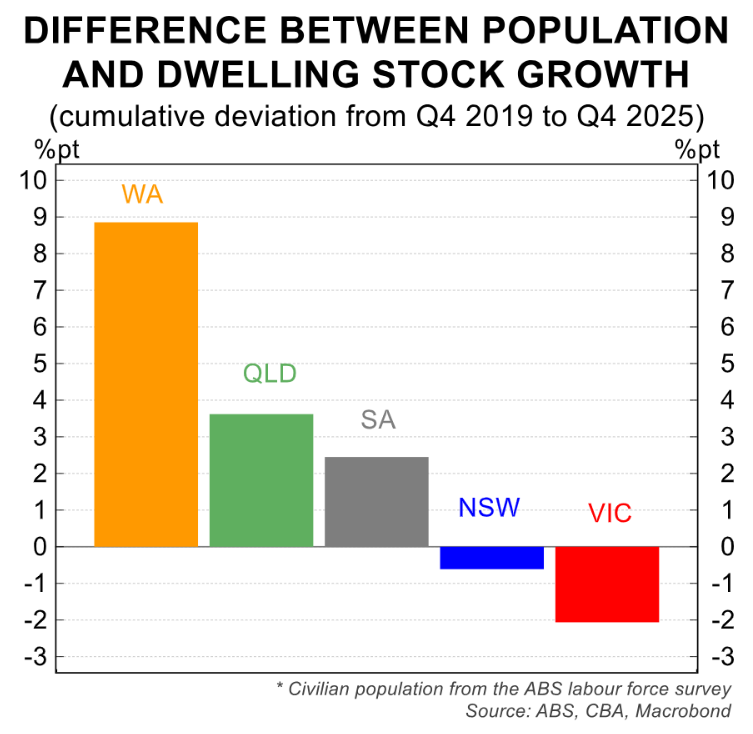
“Perth is the standout example. Since December 2019, Perth home prices have outpaced the national average by around 40%. Over the same period, WA’s population grew around 9 percentage points faster than its dwelling stock”, noted CBA.
“Brisbane tells a similar story, with home prices outpacing the capital city average by just under 30%, as the state’s population growth ran around 3.5 percentage points ahead of new dwelling supply”.
“Sydney and Melbourne are charting a different course. Relatively softer population growth and higher construction rates have seen price growth remain more subdued than the mid-sized capitals”.
“But it is hard to deny the importance of trends in underlying demand and housing supply when explaining the divergence of conditions across the states”, CBA wrote.
The data is clear: divergences in population growth from the pre-pandemic trend largely explain the divergences in dwelling value growth across Australia’s major capital cities.
Gerard Minack’s first chart above also shows that countries that have experienced strong population growth this century have also typically experienced stronger dwelling value growth.
