
Wall Street came back from its long weekend holiday and sold off immediately in response to the EU revokation of the previous Trump-induced 2025 trade deal as the fallout from the shambles over Greenland hit all risk markets. Treasury yields spiked as European bondholders started selling off US bonds, with the 10 year up near the 4.3% level while the USD fellback against, well everything. Japanese bonds should be more of a concern plus the rhetoric coming out of Davos that a global recession – a long term one too – is likely given the change in the global trading order. The Australian dollar soared back above the 67 cent level alongside gold.
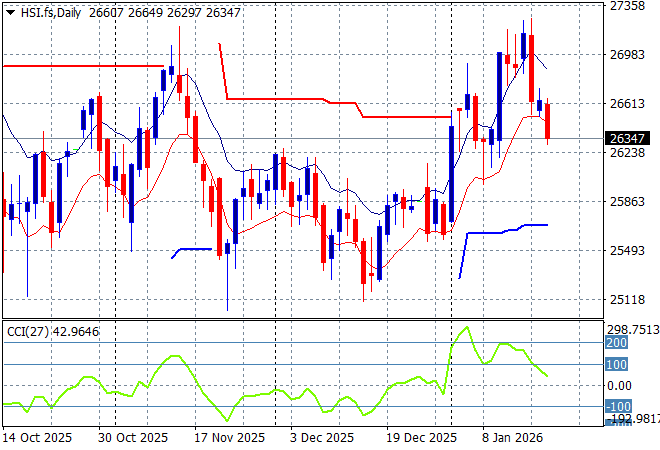
Looking at stock markets from Asia from yesterday’s session, where mainland Chinese share markets were down slightly in the afternoon session with the Shanghai Composite staying just above the 4100 point level while the Hang Seng Index lost 0.3% to close at 26487 points.
The daily chart of the Hang Seng Index showed a lot of wish washy action around the 26000 point level in the last couple of months with some recent weakness now turning into strength. However the latest small bounce off support has now reversed as resistance overhead is too strong:
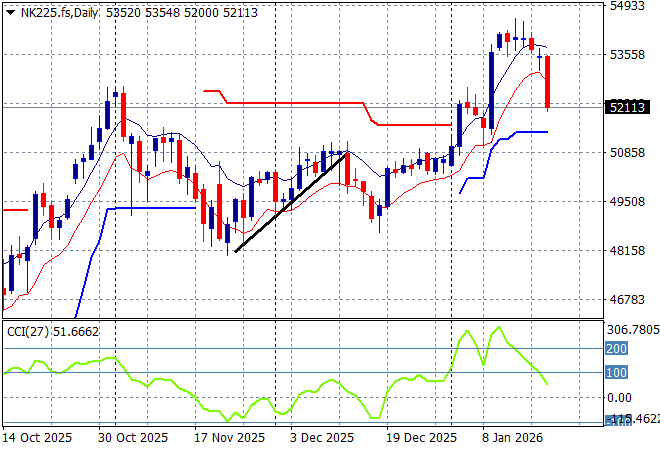
Japanese stock markets were also in retreat with the Nikkei 225 down more than 1% to just crack the 53000 point level.
Daily price action wavered a little during the BOJ hike in the previous weeks but has firmed up strongly with the 50000 point level forming key support although it has gotten ahead of itself. This was looking like a launch point through longer term overhead resistance but the selloff in Japanese bonds and the election snap call is worrying here:
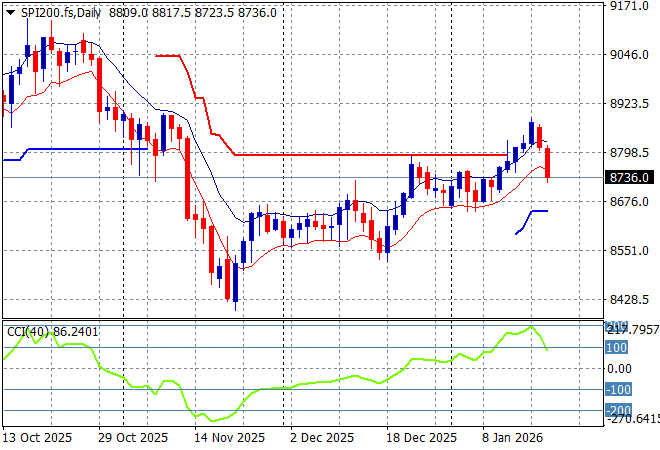
Australian stocks did not do well either with the ASX200 down 0.7% to 8815 points. SPI futures are off another 0.6% due to the big falls on Wall Street overnight.
The daily chart pattern shows that short term support has been reinforced after a period of hesitation before Christmas with a bounceback above resistance at the 8800 point area building but this looks like a rollover on a wider risk off move:
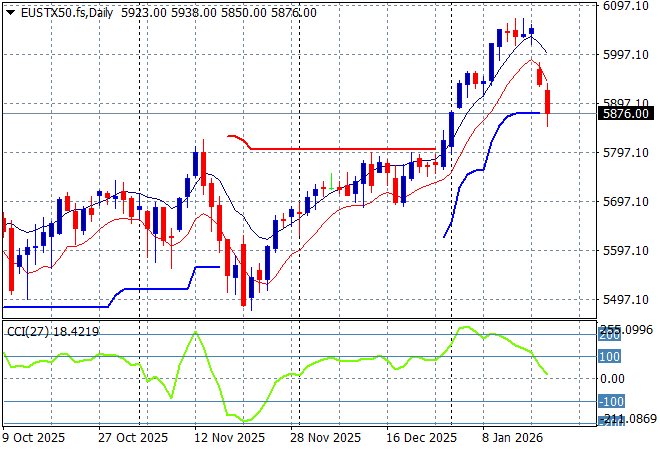
European markets were sold off across the continent again with German stocks taking the biggest hit as the Eurostoxx 50 Index closed nearly 0.6% lower to 5892 points, continuing the breakdown of the recent rally.
The market had been failing to make headway in recent months due to the too high valuations but short term support was very solid and has pushed well above recent highs to start 2026 stronger than expected. But the coming transatlantic trade war is turning this into a rollover through support:
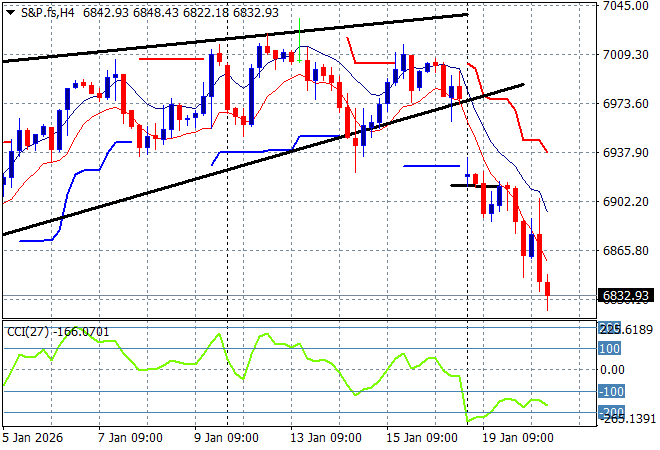
Wall Street reopened with a big slump across all markets with tech stocks falling sharply on the EU’s anti-coercion threats, the NASDAQ down nearly 3% while the S&P500 closed 2.1% lower at 6794 points.
The daily chart showed a belated Santa rally that took back some of the gains to match the November highs but a lift up towards the 7000 point level is now well off the cards as equity runs for the exits with the bearish rising wedge pattern now fully formed:
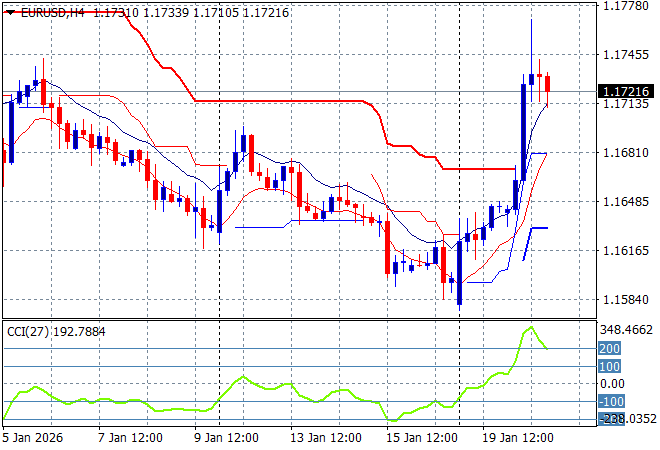
Currency markets are turning around to go anti-USD amid the Trump regime’s lunatic drive to acquire Greenland, with Europe and others standing up and pivoting away. This is going to mean increased volatility with the USD now reversing its early year gains against Euro in particular which was pushed back above the 1.17 handle overnight amongst other majors.
As the end of NATO looms on the horizon and a probable Trump tantrum at Davos looming, watch for a possible breakout to new highs if the EU triggers the next level of trade sanctions:
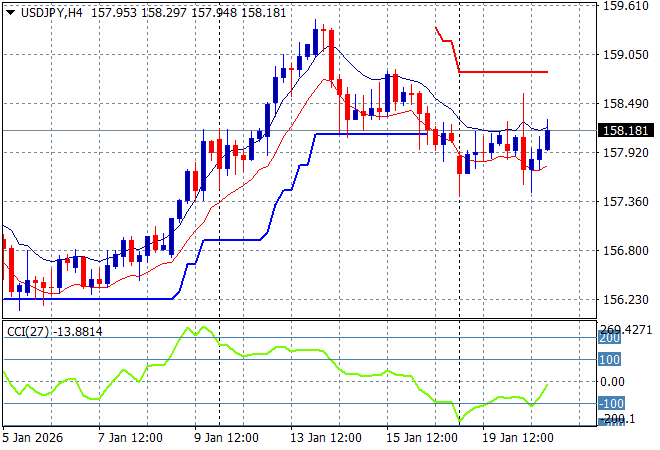
The USDJPY pair pushed well above the 157 handle on the new year sessions, despite stronger inflation in Japan with a move above the 159 level at the start of the week now pushed into the 158 level where it remained overnight.
The previous price action was sending the pair beyond the March highs and had the potential to extend those gains through to start of year position at the 158 handle. A little too much heat has been taken out after being overbought but this could be one undollar that accelerates down the tubes:
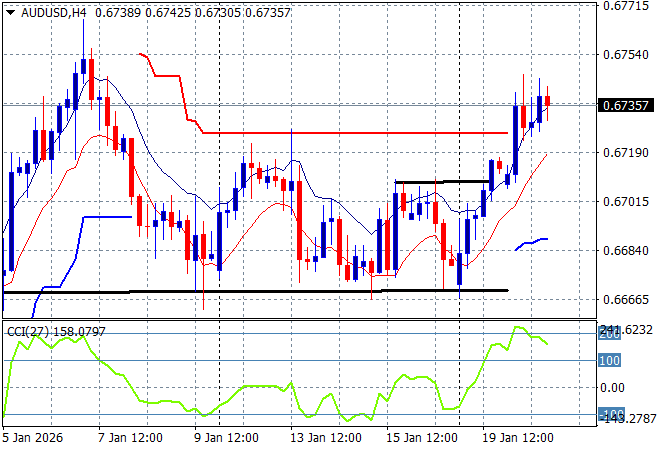
The Australian dollar has so far respected support (big black horizontal line below) and due to USD weakness has now pushed back above the 67 handle overnight on overall “Sell America” volatility.
Price action was not looking good for the Pacific Peso in the medium term as the interest rate differential squeeze sent it back to the doldrums, but short term support is shoring up but I still see overhead resistance as a barrier here:
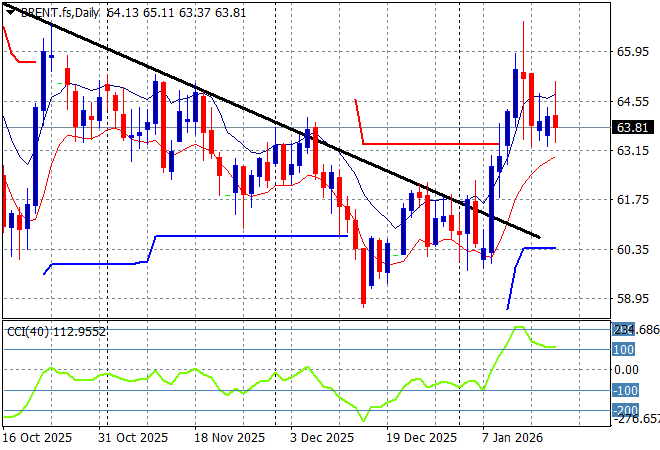
Oil markets have been on a multi week/monthly downtrend prior to the Venezuelan invasion but shot out of the gate last week with some big gains before getting ahead of itself. Brent crude is again holding around the $64USD per barrel with the potential for more falls if the “peace” Trump regime doesn’t start shooting soon.
The daily chart pattern shows an extended downtrend that is now well under threat and broken in the short term so watch for this to potentially turn into a proper reversal although it is well over extended in the short term:
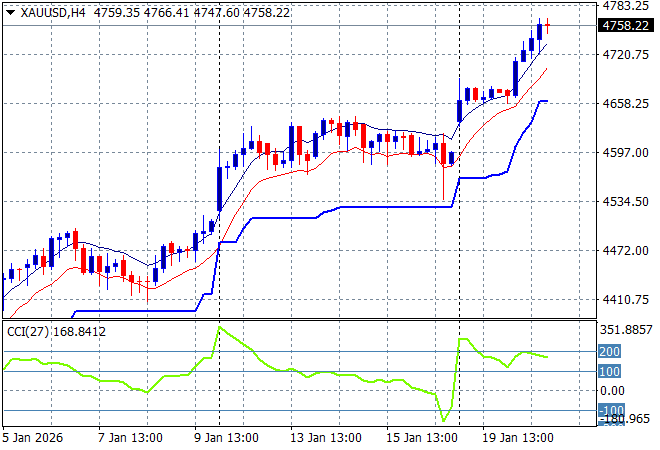
Gold was in a holding pattern, albeit with a very bullish bias above the $4600USD per ounce level after some heat was taken out of silver prices in the last couple of sessions. But its pretty clear that gold is becoming a Minsky Metal yet again with the gap higher over the weekend now pushing well above the $4700 level overnight.
As I previously mentioned that after some stability, another large upside potential move was looming again for the shiny metal as the desire for USD dwindles and here we are, albeit very overbought as short term resistance forms slightly:
Glossary of Acronyms and Technical Analysis Terms:
ATR: Average True Range – measures the degree of price volatility averaged over a time period
ATR Support/Resistance: a ratcheting mechanism that follows price below/above a trend, that if breached shows above average volatility
CCI: Commodity Channel Index: a momentum reading that calculates current price away from the statistical mean or “typical” price to indicate overbought (far above the mean) or oversold (far below the mean)
Low/High Moving Average: rolling mean of prices in this case, the low and high for the day/hour which creates a band around the actual price movement
FOMC: Federal Open Market Committee, monthly meeting of Federal Reserve regarding monetary policy (setting interest rates)
DOE: US Department of Energy
Uncle Point: or stop loss point, a level at which you’ve clearly been wrong on your position, so cry uncle and get out/wrong on your position, so cry uncle and get out!