

Wall Street stumbled amid a mixed bag of economic releases as traders pivot towards Friday’s NFP print. US 10 year Treasury yields remain elevated at their recent monthly highs but a little too quiet, while the USD is gaining strength against the majors particularly Euro and Canadian Loonie while the Australian dollar has slipped to just above the 67 cent level.
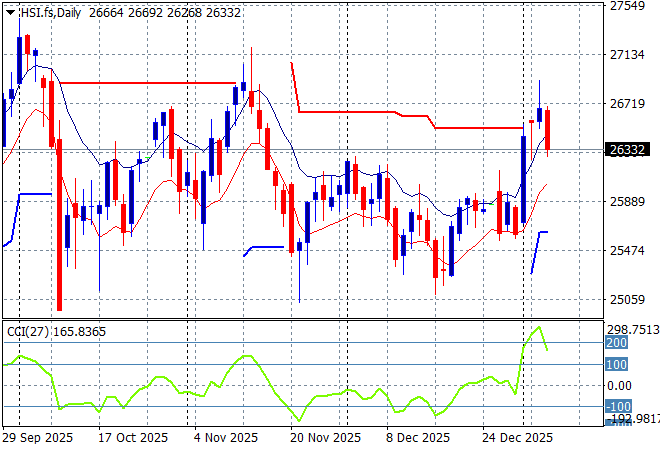
Looking at stock markets from Asia from yesterday’s session, where mainland Chinese share markets were a bit wobbly going into the afternoon session with the Shanghai Composite down slightly but still above 4000 points while the Hang Seng Index has snapped back, falling nearly 1% lower to 26458 points.
The daily chart of the Hang Seng Index showed a lot of wish washy action around the 26000 point level in the last couple of months with some recent weakness now turning into strength. The latest small bounce off support did not have a lot of momentum but there is potential to get moving up above that level again:
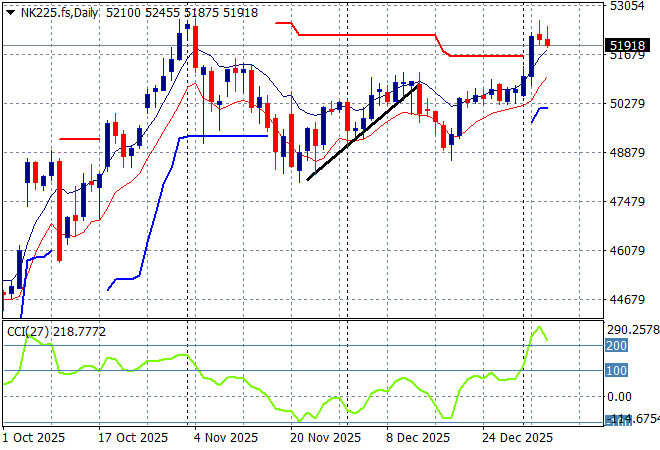
Japanese stock markets are also Japanese stock markets are also seeing a small selloff after recent exuberance with the Nikkei 225 losing more than 1% to retreat below the 52000 point leveloff into the stratosphere with the Nikkei 225 gaining another 1% to climb above 52000 points.
Daily price action wavered a little during the BOJ hike in the previous weeks but has firmed up strongly with the 50000 point level forming key support to make a new year rally stick here:
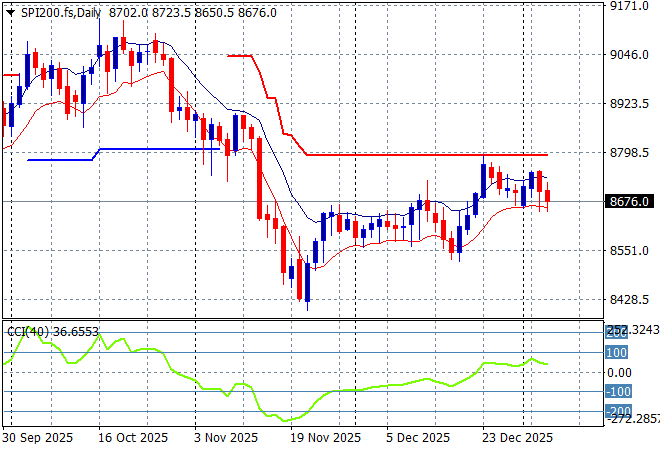
Australian stocks were the standout for a change with the ASX200 lifting nearly 0.2% higher to 8695 points. SPI futures are down nearly 0.2% due to the mixed sessions from Wall Street overnight.
The daily chart pattern shows that short term support has been reinforced after a period of hesitation before Christmas with a bounceback above resistance at the 8800 point area possible:
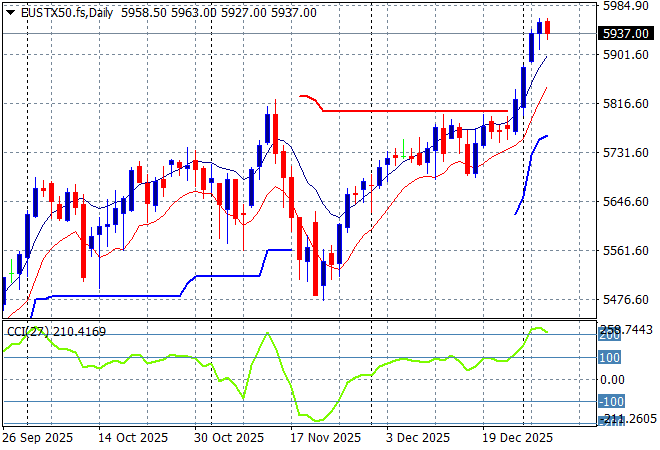
European markets were unable to close in positive territory overnight with the Eurostoxx 50 Index closing 0.1% lower at 5923 points, pausing the recent rally.
The market had been failing to make headway in recent months due to the too high valuations but short term support was very solid and has pushed well above recent highs to start 2026 with some gusto as a new breakout accelerates:
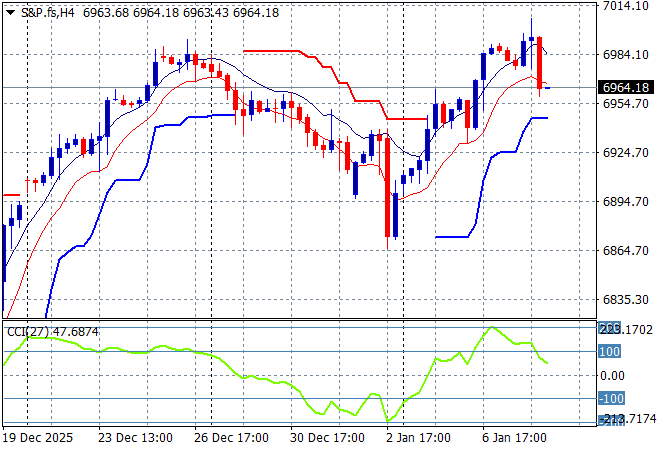
Wall Street also failed to move higher across the board with the NASDAQ the only one to put on some meagre runs while the S&P500 fell more than 0.3% to close at 6920 points.
The daily chart showed a belated Santa rally that took back some of the gains to match the November highs but it still looking well supported on the four hourly chart below with the potential to lift up towards the 7000 point level next:
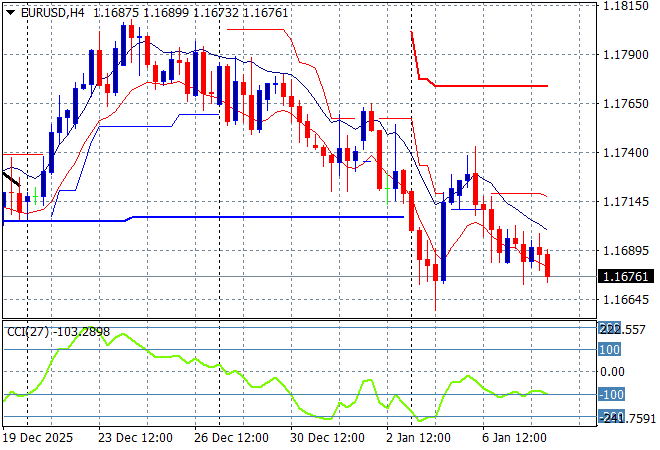
Currency markets were in a holding pattern due to the looming break over the New Year but are failing to move against King Dollar as traders anticipate an interesting NFP print on Friday. Euro was on the backfoot again overnight staying below the 1.17 handle following Pound Sterling retracing mildly while the Canadian Loonie also fell back sharply.
The union currency was pushed down to the 1.17 handle during the Xmas period and after a small bounceback is playing like a dead cat bounce here as the end of NATO looms on the horizon. Watch for a break below the recent lows:
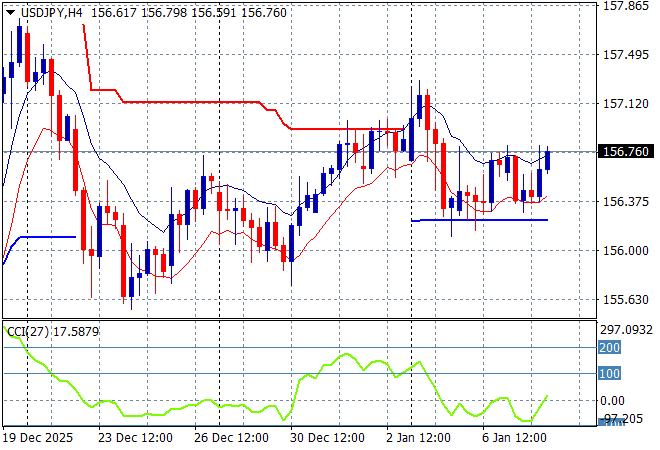
The USDJPY pair pushed well above the 157 handle on the new year sessions but since gave it all back and remains somewhat in the doldrums although it pushed to a new session high overnight.
The previous price action was sending the pair beyond the March highs and had the potential to extend those gains through to start of year position at the 158 handle. Watch for any break below the 156 handle closely next:
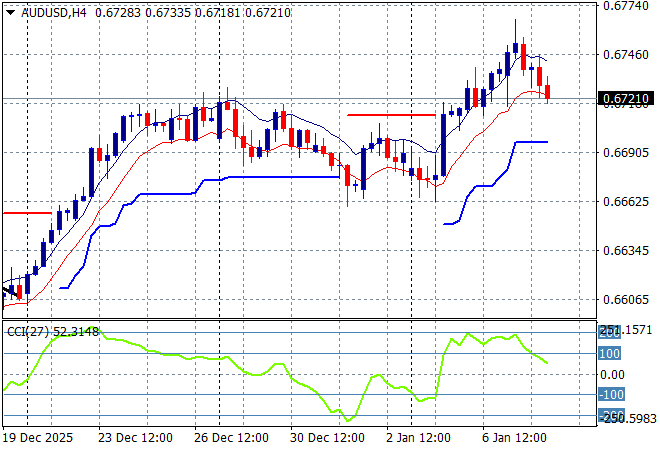
The Australian dollar was weakening throughout the pre NY period but found support at the mid 66 level where it has broken out on commodity volatility but has weakened slightly down to the 67 handle overnight.
Price action was not looking good for the Pacific Peso in the medium term as the interest rate differential squeeze sent it back to the doldrums, but this has inverted as the RBA moves to a much hawkish position:
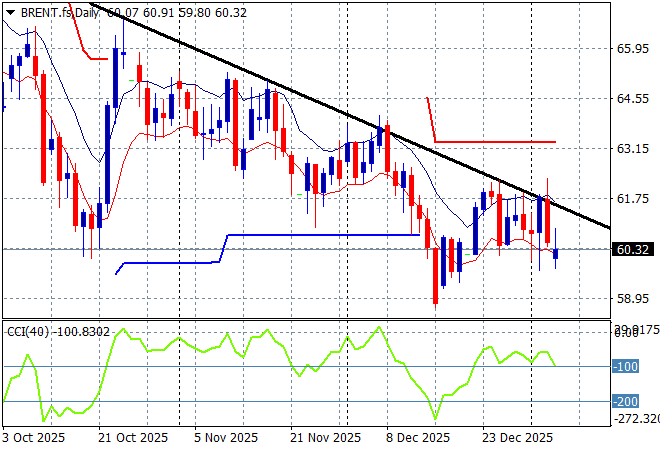
Oil markets have been on a multi week/monthly downtrend prior to all the Venezuelan invasion with Brent crude and a potential rally was brewing but reality – that it will take months or years to actually physically change the output of heavy crude – is setting in, as it fell back to $60USD per barrel again overnight.
The daily chart pattern shows an extended downtrend that is coming under threat but this really just getting back to the trendline proper and not yet a breakout:
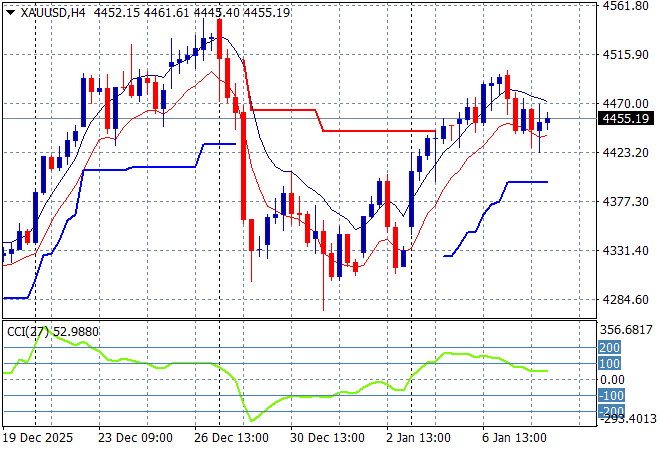
Gold had been using the $4300USD per ounce level as strong support throughout the NY/Xmas period and made a comeback on USD weakness although it paused overnight just below the $4500USD per ounce level.
As I previously mentioned that after some stability, another large upside potential move was looming again for the shiny metal as the desire for USD dwindles and here we are, albeit very overbought as short term resistance forms slightly:
Glossary of Acronyms and Technical Analysis Terms:
ATR: Average True Range – measures the degree of price volatility averaged over a time period
ATR Support/Resistance: a ratcheting mechanism that follows price below/above a trend, that if breached shows above average volatility
CCI: Commodity Channel Index: a momentum reading that calculates current price away from the statistical mean or “typical” price to indicate overbought (far above the mean) or oversold (far below the mean)
Low/High Moving Average: rolling mean of prices in this case, the low and high for the day/hour which creates a band around the actual price movement
FOMC: Federal Open Market Committee, monthly meeting of Federal Reserve regarding monetary policy (setting interest rates)
DOE: US Department of Energy
Uncle Point: or stop loss point, a level at which you’ve clearly been wrong on your position, so cry uncle and get out/wrong on your position, so cry uncle and get out!