
A near two year low in the US ISM manufacturing print saw the USD take a dive while other risk markets repositioned after the Trump regime’s invasion of Venezuela with oil stocks lifting amid a small bid in Brent and WTI markers. Wall Street was outpaced by European and Japanese stocks while Pound Sterling and Euro both fought back after a small new year rally in King Dollar. Bond markets also saw a surprise bid on geopolitical uncertainty – who is next in the firing line as the old order crumbles – with the Australian dollar bouncing back above the 67 cent level as we prepare for the long wait til the February RBA meeting.
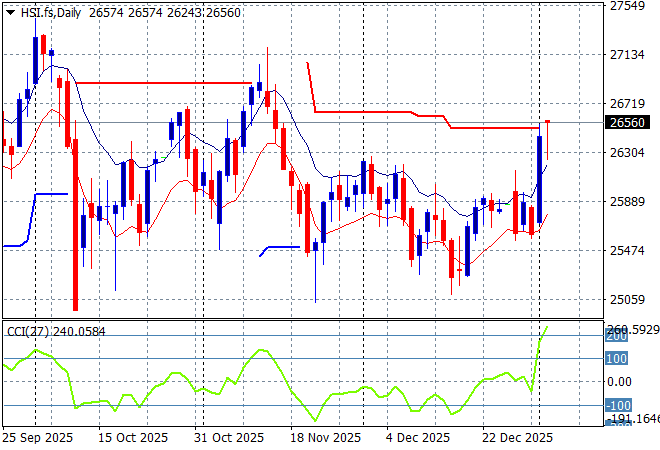
Looking at stock markets from Asia from yesterday’s session, where mainland Chinese share markets are seeing solid upside with the Shanghai Composite up more than 1% to climb above 4000 points while the Hang Seng Index has put in a scratch session to settle at 26317 points.
The daily chart of the Hang Seng Index shows a lot of wish washy action around the 26000 point level in the last couple of months with some recent weakness now turning into strength. The latest small bounce off support did not have a lot of momentum but there is potential to get moving up above that level again:
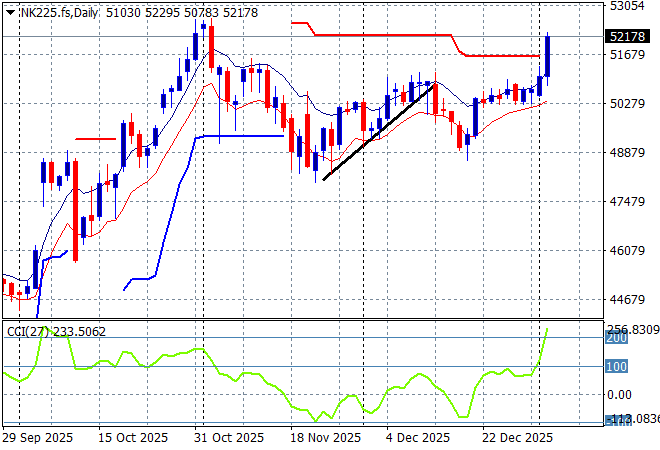
Japanese stock markets are doing all the heavy lifting with the Nikkei 225 surging nearly 3% higher to 51905 points.
Daily price action wavered a little during the BOJ hike in the previous weeks but has firmed up strongly with the 50000 point level forming key support to make a new year rally stick here:
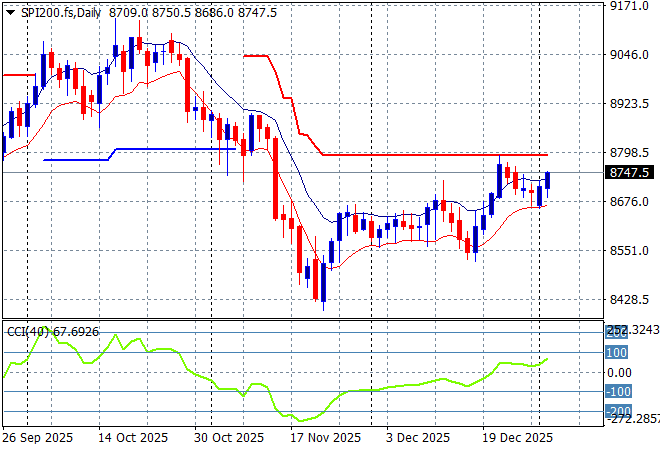
Australian stocks went nowhere in comparison with the ASX200 dead flat at 8728 points. SPI futures are up nearly 0.4% however given the very solid session from Wall Street overnight.
The daily chart pattern shows that short term support has been reinforced after a period of hesitation before Christmas with a bounceback above resistance at the 8800 point area possible:
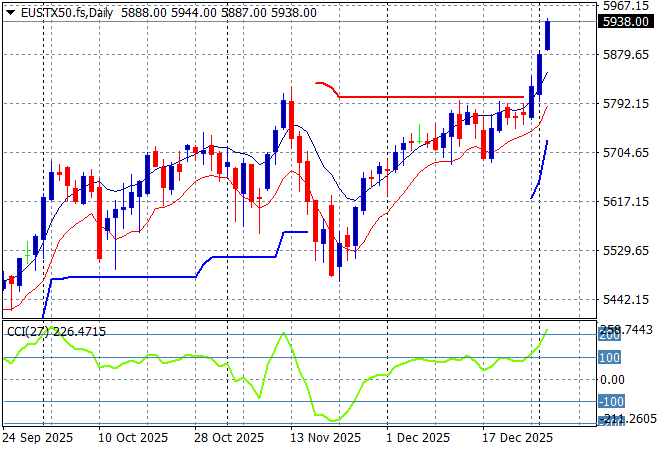
European markets were very buoyant again as trading volumes picked up across the continent with the Eurostoxx 50 Index started the year with a bang, moving more than 1.2% higher to 5923 points.
The market had been failing to make headway in recent months due to the too high valuations but short term support was very solid and has pushed well above recent highs to start 2026 with some gusto as a new breakout accelerates:
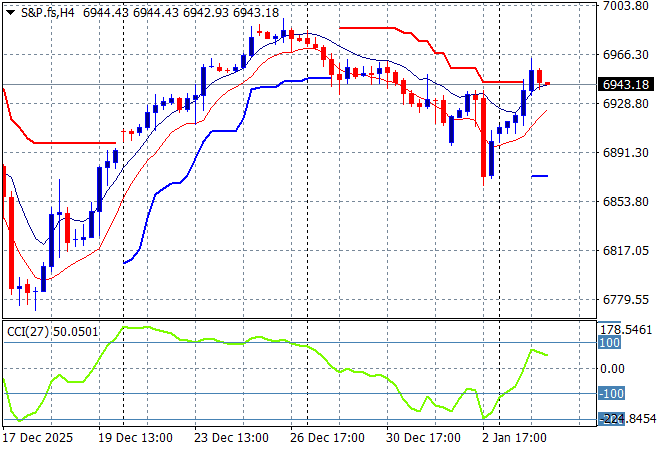
Wall Street also moved higher across the board with the NASDAQ gaining 0.7% to climb back towards its recent highs while the S&P500 lifted the same to close at 6902 points.
The daily chart showed a belated Santa rally that took back some of the gains to match the November highs but it still looking well supported on the four hourly chart below with the potential to lift up towards the 7000 point level next:
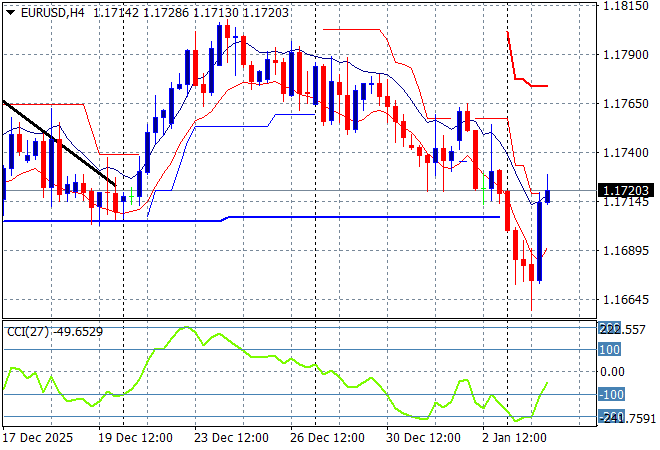
Currency markets were in a holding pattern due to the looming break over the New Year but are now moving against King Dollar again despite the recent volatility around the BOJ rate hike. Euro was on the backfoot at first overnight falling below the 1.17 handle but bounced back after the bad ISM print while Pound Sterling and Canadian Loonie returned to their recent monthly highs.
The union currency was pushed down to the 1.17 handle where after threatening to break has now built above that as short term support to launch back to its previous highs:
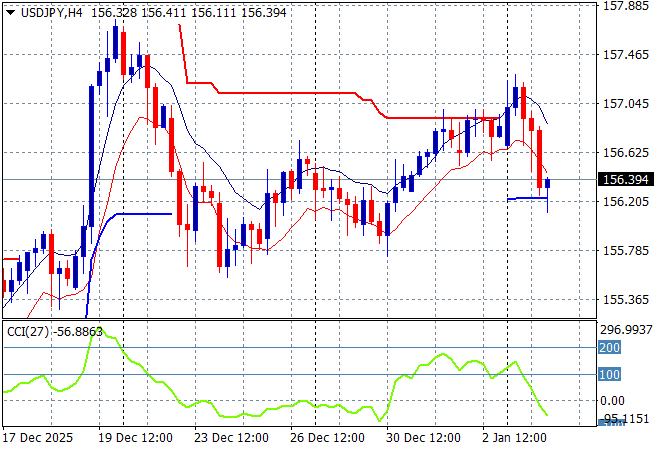
The USDJPY pair pushed well above the 157 handle on the new year sessions but since gave it all back overnight as weakness in USD was built in.
The previous price action was sending the pair beyond the March highs and had the potential to extend those gains through to start of year position at the 158 handle. Watch for any break below the 156 handle closely next:
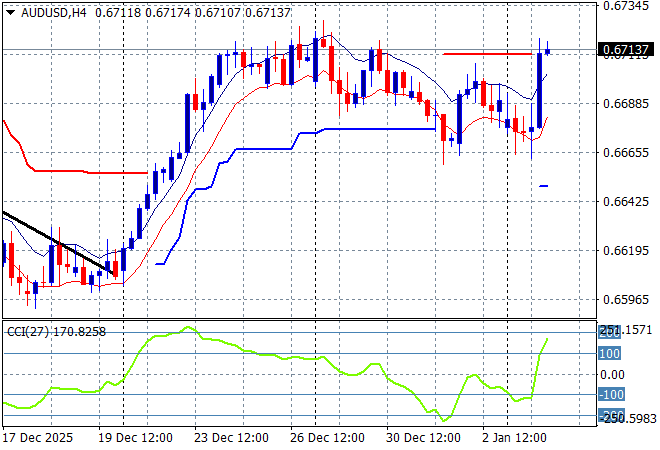
The Australian dollar was weakening throughout the pre NY period but found support at the mid 66 level where it then broke out on USD weakness overnight to almost get back to its pre Xmas highs above the 67 handle early this morning.
Price action was not looking good for the Pacific Peso in the medium term as the interest rate differential squeeze sent it back to the doldrums, but this has inverted as the RBA moves to a much hawkish position. A new monthly high as we head into the new year:
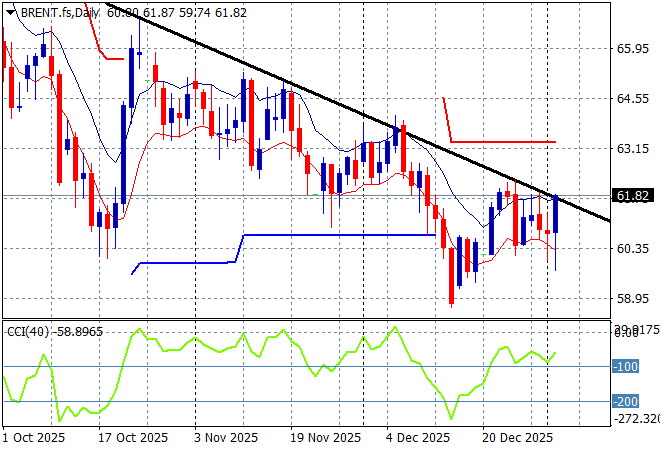
Oil markets have been on a multi week/monthly downtrend prior to all the Venezuelan invasion with Brent crude recently pushed below the $59USD per barrel level and post the Maduro capture, their has been a small lift overnight to just below the $62 level.
The daily chart pattern shows an extended downtrend that is coming under threat but this really just getting back to the trendline proper and not yet a breakout:
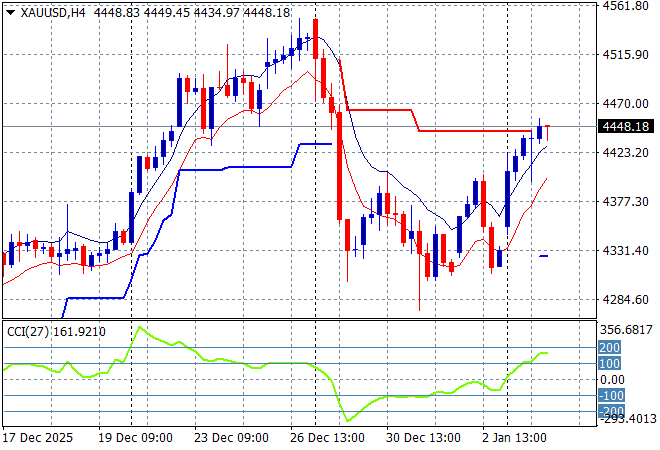
Gold had been using the $4300USD per ounce level as strong support throughout the NY/Xmas period and has made a comeback on USD weakness with a surge above the $4400USD per ounce level overnight.
As I previously mentioned that after some stability, another large upside potential move was looming again for the shiny metal as the desire for USD dwindles and here we are, albeit very overbought as short term resistance forms slightly:
Glossary of Acronyms and Technical Analysis Terms:
ATR: Average True Range – measures the degree of price volatility averaged over a time period
ATR Support/Resistance: a ratcheting mechanism that follows price below/above a trend, that if breached shows above average volatility
CCI: Commodity Channel Index: a momentum reading that calculates current price away from the statistical mean or “typical” price to indicate overbought (far above the mean) or oversold (far below the mean)
Low/High Moving Average: rolling mean of prices in this case, the low and high for the day/hour which creates a band around the actual price movement
FOMC: Federal Open Market Committee, monthly meeting of Federal Reserve regarding monetary policy (setting interest rates)
DOE: US Department of Energy
Uncle Point: or stop loss point, a level at which you’ve clearly been wrong on your position, so cry uncle and get out/wrong on your position, so cry uncle and get out!