
Wall Street rebounded again on Friday night on renewed hope that the December rate cut maybe in play all due to the comments of Fed NY Chair Williams. This is going to probably lead to a significant lift on Asian share markets this morning, with SPI futures up at least 1% plus increased chances of a Ruzzian/Ukrainian peace deal giving commodity prices a boost as well. The USD remains somewhat strong against most of the majors but could gap down over the weekend as Yen lifted on Friday while the Australian dollar is looking to stabilise just below the 65 cent level.
Looking at stock markets from Asia from yesterday’s session, where mainland Chinese share markets fell sharply in afternoon trade with the Shanghai Composite down more than 2% lower to 3834 points while the Hang Seng Index went down nearly 2.5%, closing at 25220 points.
The daily chart of the Hang Seng Index shows a complete fill of the March/April selloff with a resumption of buying above 26000 points as momentum tried to build but failed to push aside resistance, with this rollover about to hit support around the high 24000’s:

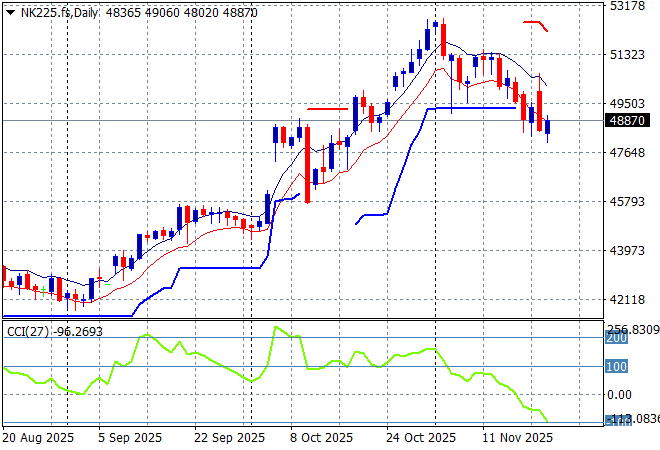
Japanese stock markets were equal biggest losers with the Nikkei 225 falling more than 2.4% to 48625 points.
Daily price action was looking extremely keen indeed as daily momentum accelerated after clearing resistance at the 42000 point level with another equity market that looks very stretched and breaking out a bit too strongly here. ATR support is now broken at the 50000 point level but daily momentum is not yet considerably oversold:
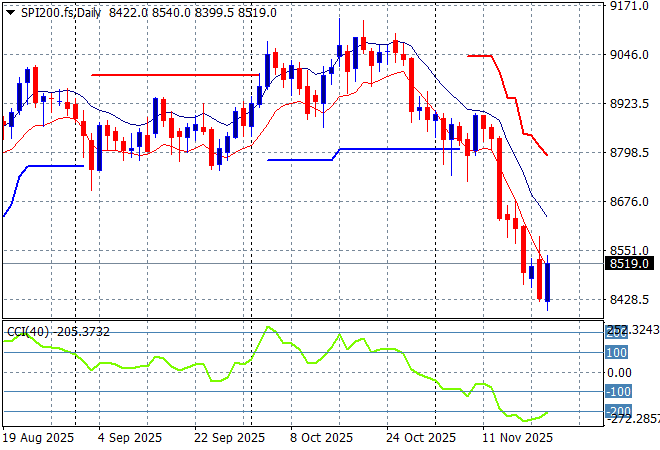
Australian stocks sold off across the board with the ASX200 eventually closing 1.6% lower at 8416 points. SPI futures are up a full 1% or more based on the volatility on Wall Street on Friday night.
The daily chart pattern was suggesting further upside still possible with a base built above the 8700 point level as daily momentum tried to maintain its overbought status. Short term support has been abandoned, as momentum builds for a broader selloff but watch for some stability to try to return to the 8500 point area:
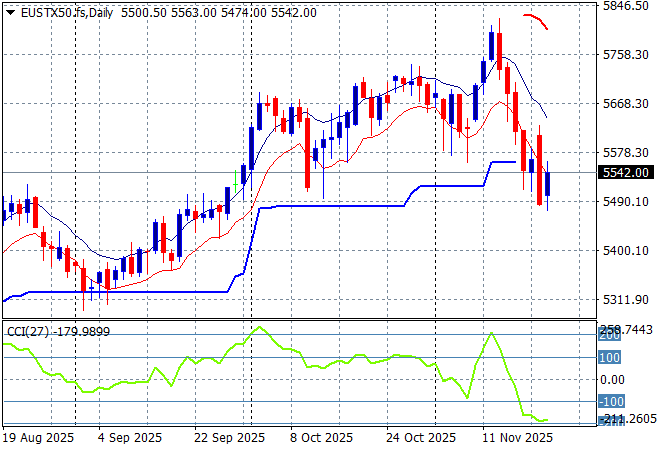
European markets were unable to get out of sell mode as they played catchup to the temporary risk off mood with the Eurostoxx 50 Index closing 1% lower at 5515 points.
The market has been failing to make headway here due to the too high valuations but short term support looks broken here as well with a bearish engulfing candle indicating there could be more selling at play here as tensions build across the continent:
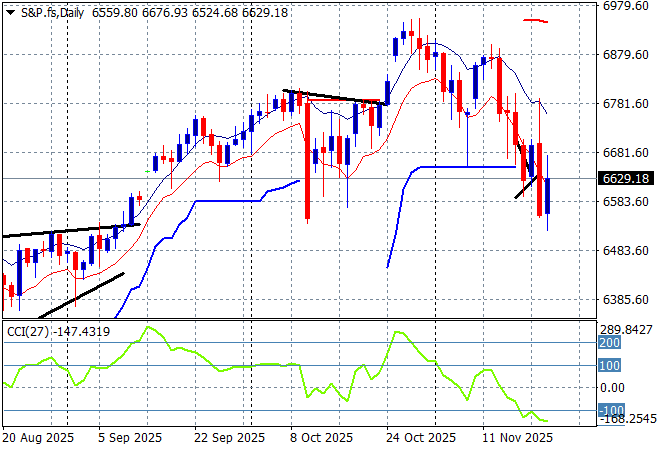
Wall Street had a bounce back with the NASDAQ up nearly 1% while the S&P500 managed to finish exactly 1% higher at 6602 points.
The four hourly chart showed that resistance at the 6900 point level was still quite relevant after the bounceback from the end of the US government shutdown rally. The daily chart shows that the recent dead cat bounce was developing more into a proper downtrend and unless support remains firm at 6500 points, this could continue into the shorter trading week:
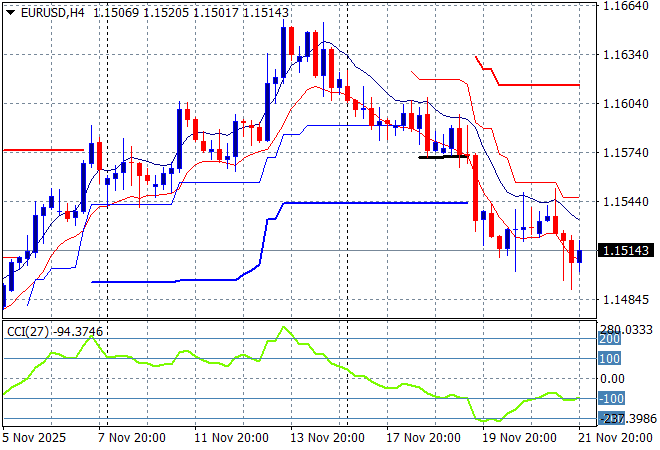
Currency markets had recently swung back fully to USD strength as the September NFP print (remember no October print and a late November one) were being overshadowed by increased inflation in the US, giving pause to rate cut chances in the December meeting. This was changed somewhat by Williams comments on Friday, taking a little wind out of the sails of King Dollar with Euro managing to stabilise a little bit after its selloff around the 1.15 handle, with Pound Sterling doing better to almost get above the 1.31 handle.
The union currency was building strength as it climbed above previous ATR resistance at the 1.1580 area but momentum has switched to oversold settings in the short term with this weakness below the 1.16 handle probably broadening, but those long tails with tight wicks on the four hourly chart are speaking to some possible stability:
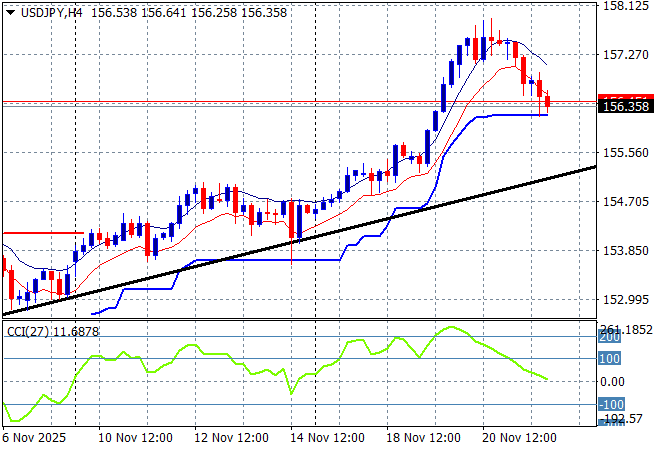
The USDJPY pair was having a cracking move higher helped by a much weaker Yen amid the China/Japan diplomatic stoush plus the prospect of higher rates from the BOJ, but Friday night saw this heat taken out of the uptrend with a reversion back to the 156 handle.
The previous price action was sending the pair beyond the March highs and had the potential to extend those gains through to start of year position at the 158 handle and this recent volatility has now repeated this move but watch for a probable violent reversal:
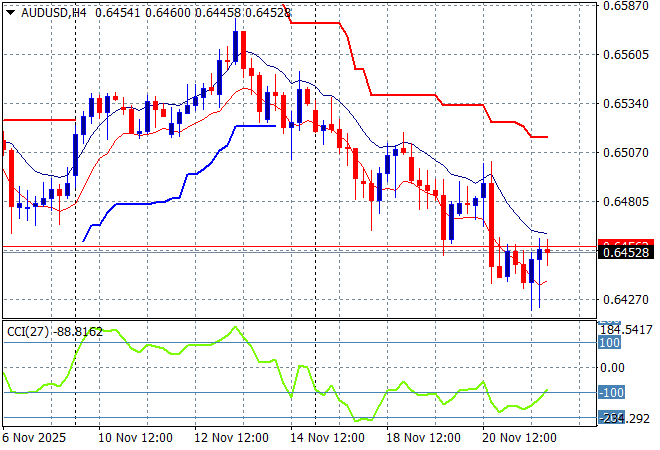
The Australian dollar only had a small reprieve in the previous session before rolling over fully to make a new monthly low, now testing the 64 handle on USD strength amid concerns although there is growing potential for the RBA to juice the slowing Aus economy as well.
This is not looking good for the Pacific Peso in the medium term as the interest rate differential squeeze plus the risk off squeeze is sending it back to the doldrums, but watch for the usual monthly volatility to confuse the non technical traders who might consider it a new uptrend, when its likely just going to be resistance at the 65 cent area that will be tested:
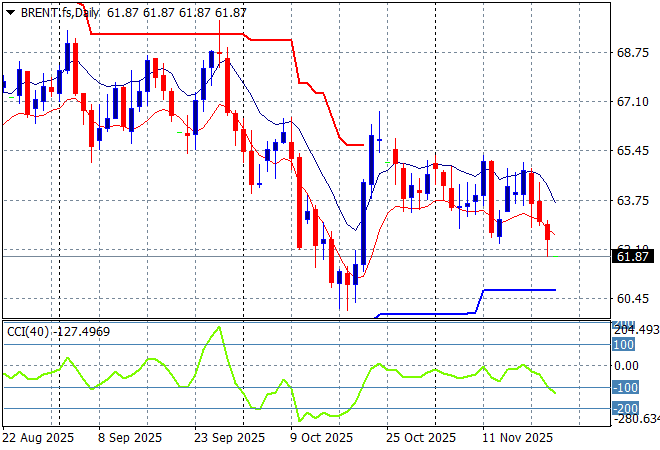
Oil markets have been trying to remain stable with a potential breakout building but the Ruzzian/Trump regimes Ukraine war talks are taking a lot more heat out of the market again with Brent crude pushed down towards the $61USD per barrel level on Friday night.
The daily chart pattern shows the post New Year rally has a distant memory with any potential for a rally up to the $80 level completely dissipating. There is still potential here for a run down to the $60 level next as the floor at the $63 area is melting away:
Gold was having a much better run than other undollars and zoomed through the $4200USD per ounce level during last week but has put in a small reversal and has remained below the $4100 level on Friday night.
This could be another slightly overdone in the short term ride but then after some more stability, yet another large upside potential move is looming again for the shiny metal as the desire for USD dwindles. Watch for the $4100 area for signs of a further breakout:

Glossary of Acronyms and Technical Analysis Terms:
ATR: Average True Range – measures the degree of price volatility averaged over a time period
ATR Support/Resistance: a ratcheting mechanism that follows price below/above a trend, that if breached shows above average volatility
CCI: Commodity Channel Index: a momentum reading that calculates current price away from the statistical mean or “typical” price to indicate overbought (far above the mean) or oversold (far below the mean)
Low/High Moving Average: rolling mean of prices in this case, the low and high for the day/hour which creates a band around the actual price movement
FOMC: Federal Open Market Committee, monthly meeting of Federal Reserve regarding monetary policy (setting interest rates)
DOE: US Department of Energy
Uncle Point: or stop loss point, a level at which you’ve clearly been wrong on your position, so cry uncle and get out/wrong on your position, so cry uncle and get out!