
Equity markets have not yet gone full risk off but last week saw a lot of confidence fall out of Wall Street with a variety of causes to blame – the AI bubble, the slowing US economy due to the shutdown and tariff impacts, but also the looming release of the Epstein files. Tech stocks led the selloff but it extended across all risk markets as concerns mount that interest rates across the central bank complex are going to rise across 2026 with the chance of a Fed cut in December falling to less than 40%. The USD only firmed against the commodity currencies during the week as the Chinese economy broadcasts a probable slowdown with the Australian dollar caught up in the risk off mood, hovering around the 65 cent level.
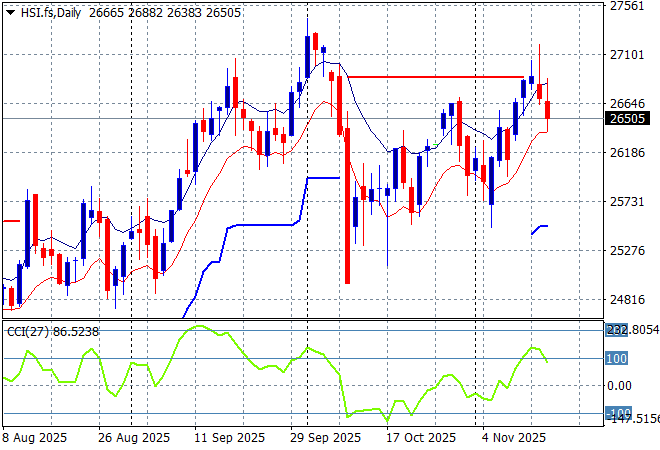
Looking at stock markets from Asia from Friday’s session, where mainland Chinese share markets were relatively steady going into the close before a big selloff saw the Shanghai Composite fall nearly 1% to close just below the 4000 point barrier while the Hang Seng Index finished nearly 2% lower, closing at 26572 points.
The daily chart of the Hang Seng Index shows a complete fill of the March/April selloff with a resumption of buying above 26000 points as momentum builds properly again but I do note some resistance building here, so watch for a proper rollover soon:
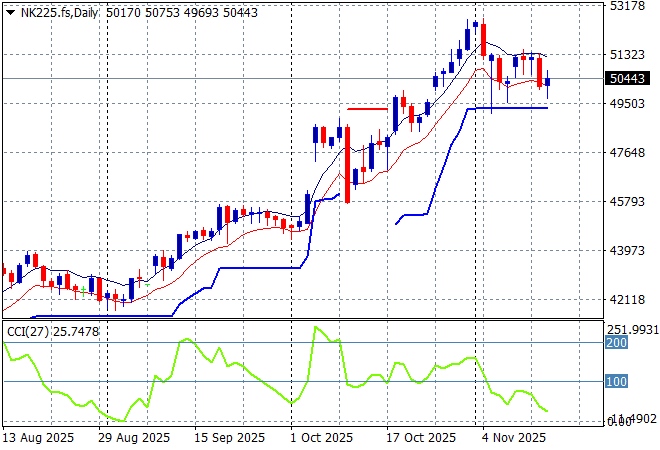
Japanese stock markets sold off sharply as well with the Nikkei 225 down more than 1.7% to almost retreat below the 50000 point level, closing the week at 50376 points.
Daily price action was looking extremely keen indeed as daily momentum accelerated after clearing resistance at the 42000 point level with another equity market that looks very stretched and breaking out a bit too strongly here. ATR support has been ratcheting up for awhile as the 50000 point level becomes the crucial pivot point going forward:
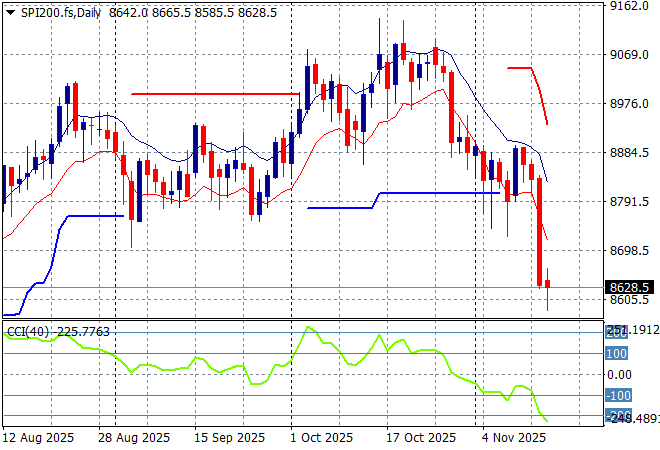
Australian stocks were in line to have the worst falls in the region with the ASX200 eventually closing nearly 1.4% lower at 8634 points. SPI futures are down slightly due to the uneasy finish on Wall Street from Friday night.
The daily chart pattern was suggesting further upside still possible with a base built above the 8700 point level as daily momentum tried to maintain its overbought status. Short term support is no longer holding on, as momentum builds for a broader selloff:
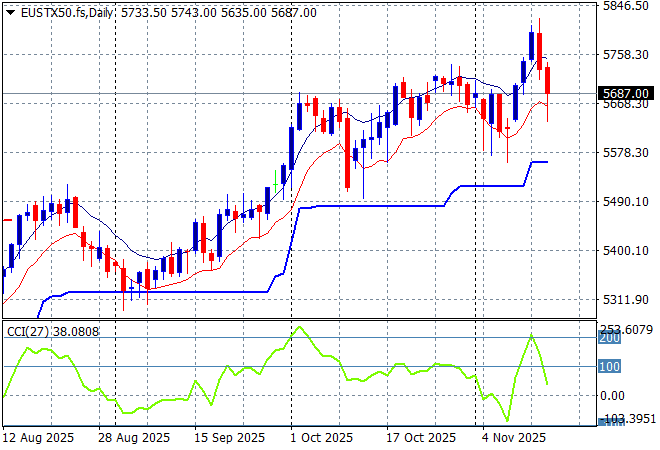
European markets couldn’t escape the selling off but managed to pare back some losses later in the session with the Eurostoxx 50 Index closing some 0.8% lower at 5693 points.
Weekly support has been respected after a brief touch below the 5200 point level as the recent rebound on Euro weakness shows a complete fill. The market has been failing to make headway here due to the too high valuations but upside potential is now coming to fruition above the 5750 point area, if short term support can hold the line:
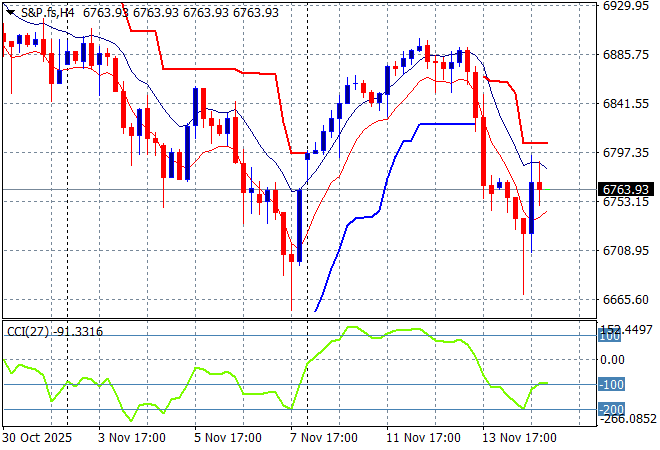
Wall Street was very uneasy with an unstable session to say the least with the NASDAQ actually finishing just in the green while the S&P500 managed to close with a scratch session, down just 1 point to 6734 points.
The four hourly chart shows that resistance at the 6900 point level is still quite relevant after the bounceback from the supposed end of the US government shutdown rally. Watch for a potential rollover here more on macro/political catalysts:
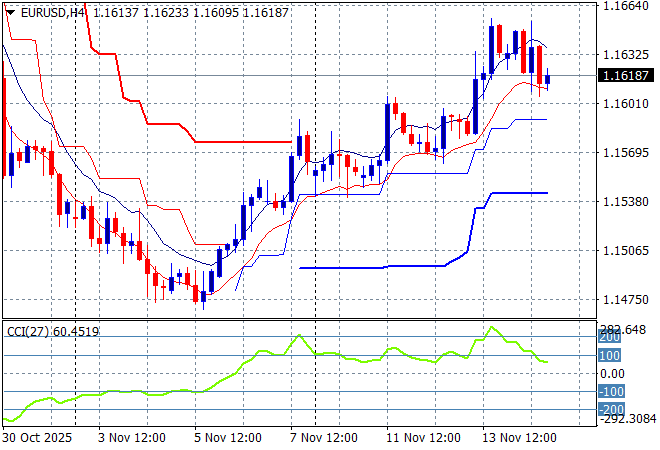
Currency markets are still broadcasting the fact that King Dollar’s days are numbered although the upcoming December Fed meeting could pull some of the undollars back in line if a rate cut is off the table. Euro is still trying to turn things around to zoom back above the 1.16 level
The union currency is building strength as it climbs above previous ATR resistance at the 1.1580 area but momentum is no longer overbought in the short term so I’m expecting some weakness to develop around the 1.16 handle this week:
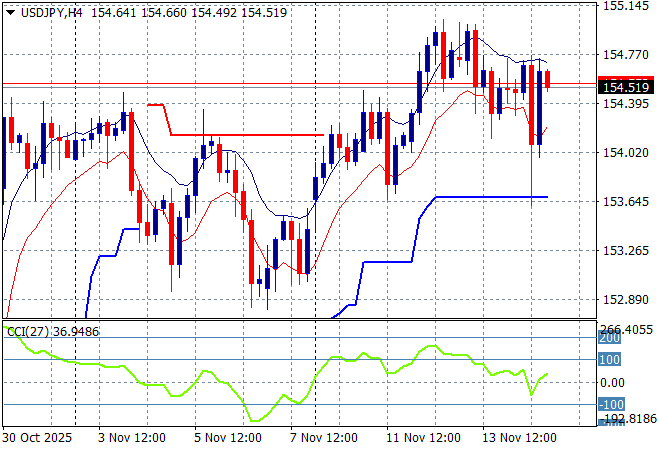
The USDJPY pair put in a consolidation phase before rallying on the Fed cut, then in the post non-NFP period it has now exceeded the previous highs as it broke above the 154 handle but has again pulled back to this support/resistance zone amid the risk off mood.
The previous price action was sending the pair beyond the March highs and had the potential to extend those gains through to start of year position at the 158 handle and this recent volatility is wanting to repeat this move:
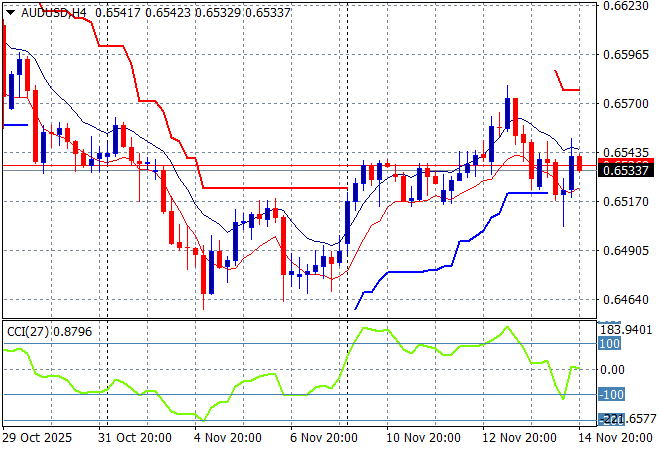
The Australian dollar was looking to breakout on the firm unemployment print and almost hit the 66 cent level before selling off mid week amid the risk off mood on equity markets to return back to the 65 handle point of control.
There continues to be buying support in the Pacific Peso in the short term on the probability of no more cuts from the RBA, but I’m still watching for a rollover below short term ATR support at the 65 handle in the event of a proper risk off event:
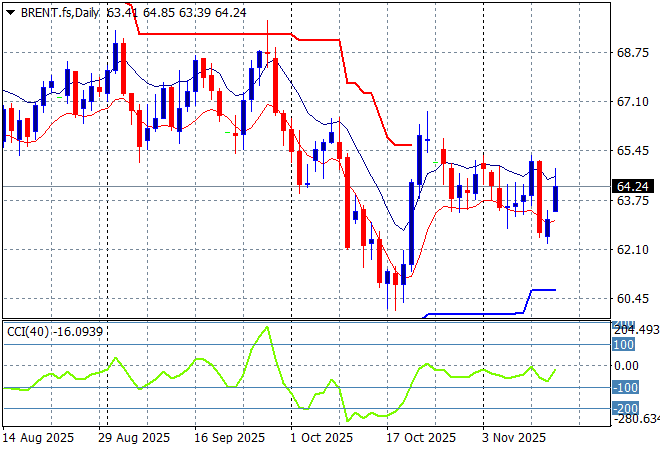
Oil markets have been trying to remain stable with a potential breakout building but continue to be thwarted by macro-political concerns as Brent crude returned to the $64USD per barrel level on Friday night.
The daily chart pattern shows the post New Year rally has a distant memory with any potential for a rally up to the $80 level completely dissipating. There was potential here for a run down to the $60 level next so I’m watching to see if the previous daily highs become resistance areas next:
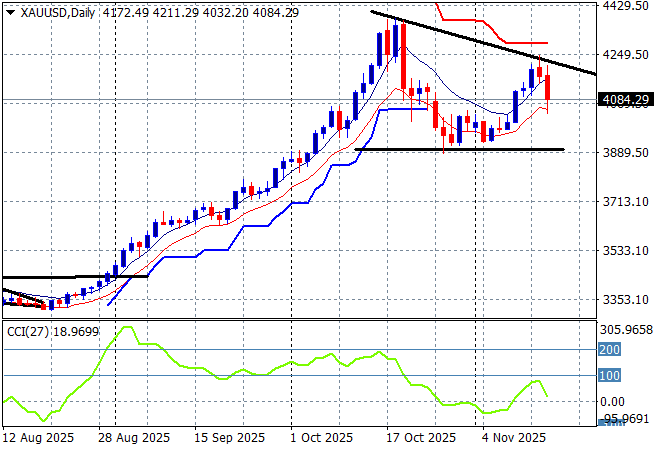
Gold was having a much better run than other undollars and zoomed through the $4200USD per ounce level during the week but then pulled back to finish below the $4100 level this morning, but still above short term support.
This could be another slightly overdone in the short term ride but then after some more stability, yet another large upside potential move is looming again for the shiny metal as the desire for USD dwindles:
Glossary of Acronyms and Technical Analysis Terms:
ATR: Average True Range – measures the degree of price volatility averaged over a time period
ATR Support/Resistance: a ratcheting mechanism that follows price below/above a trend, that if breached shows above average volatility
CCI: Commodity Channel Index: a momentum reading that calculates current price away from the statistical mean or “typical” price to indicate overbought (far above the mean) or oversold (far below the mean)
Low/High Moving Average: rolling mean of prices in this case, the low and high for the day/hour which creates a band around the actual price movement
FOMC: Federal Open Market Committee, monthly meeting of Federal Reserve regarding monetary policy (setting interest rates)
DOE: US Department of Energy
Uncle Point: or stop loss point, a level at which you’ve clearly been wrong on your position, so cry uncle and get out/wrong on your position, so cry uncle and get out!