
No jobs report for you! So that’s two months of non-existent unemployment data from the US due to the Republicans shutting down their own government so markets are unable to navigate or pivot on the non-farm payroll data and instead wonder at what is going on “under the hood” of the world’s largest economy (for now). Instead, Canadian data showed a surprise uptick lifting the Loonie and Wall Street eventually ended up with a stable finish to a hectic week with the Australian dollar just unable to climb back above the 65 cent level.
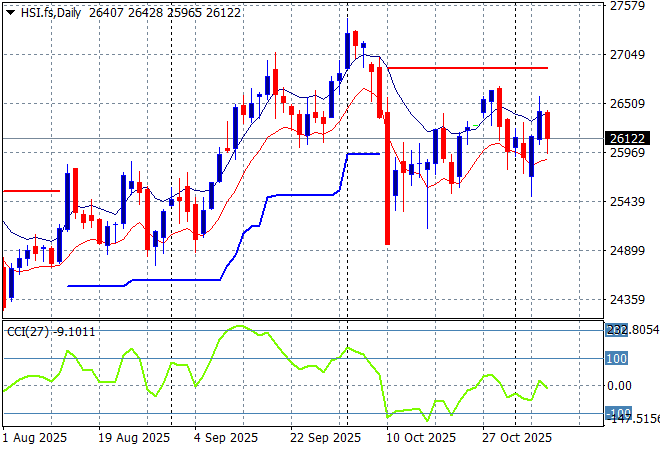
Looking at stock markets from Asia from Friday’s session, where mainland Chinese share markets were unsteady going into the close with the Shanghai Composite down 0.2% to remain below the 4000 point barrier while the Hang Seng Index was off at least 1% lower, currently at 26184 points
The daily chart of the latter showed a complete fill of the March/April selloff and then some with a breakout above the 26000 point level looking like a sustained move here before the most recent Trump tantrum. A resumption of buying here above 26000 points is slowly underway but I’m very cautious here due to lack of momentum:
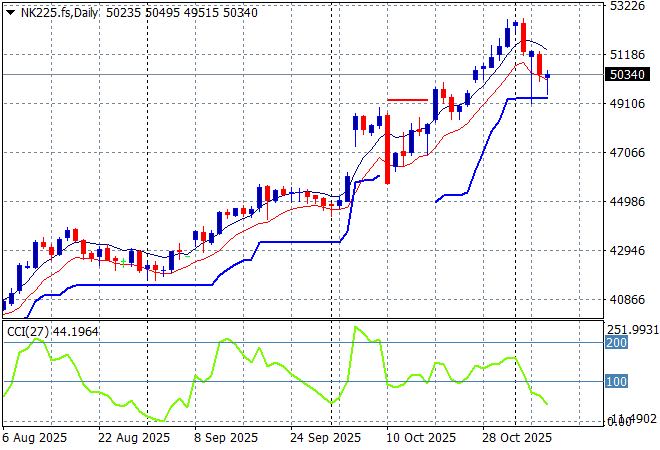
Japanese stock markets were the worst performers in the region with the Nikkei 225 down at least 2% at one stage to close 1.2% lower to close at 50276 points.
Daily price action was looking extremely keen indeed as daily momentum accelerated after clearing resistance at the 42000 point level with another equity market that looks very stretched and breaking out a bit too strongly here. ATR support has been ratcheting up for awhile as the 50000 point level becomes the crucial pivot point going forward:
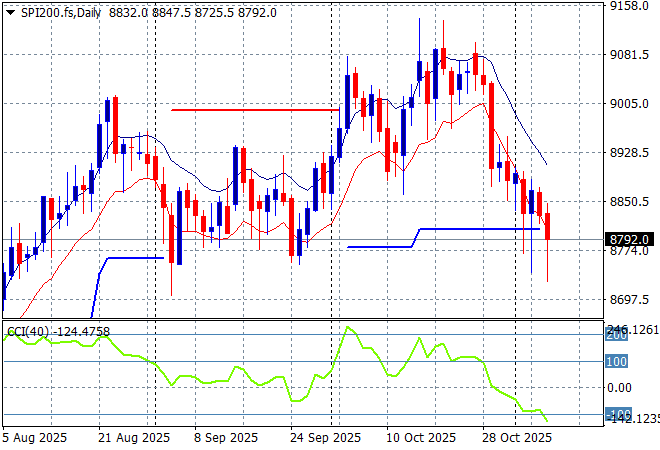
Australian stocks were the best performers in the region with only a mild selloff, with the ASX200 closing 0.6% lower at 8769 points. SPI futures are up nearly 0.3% on a wobbly Wall Street session on Friday night.
The daily chart pattern was suggesting further upside still possible with a base built above the 8700 point level as daily momentum tried to maintain its overbought status. Short term support is just holding on, but the momentum is just not here and the punchbowl has been taken away:
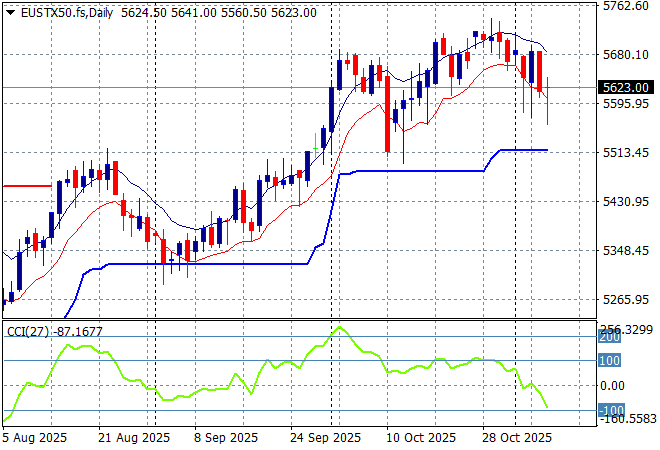
European markets were selling off again across the continent and in Brexitland as the Eurostoxx 50 Index closed 0.8% lower at 5566 points.
Weekly support has been respected after a brief touch below the 5200 point level as the recent rebound on Euro weakness shows a complete fill. However the market is failing to make headway here due to the too high valuations as upside potential looks fleeting for now:
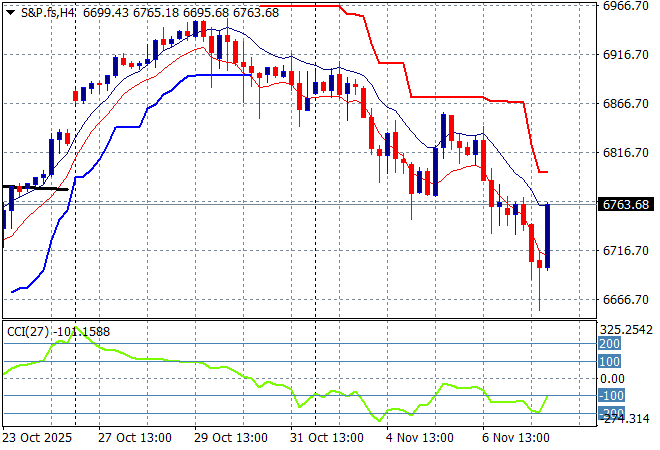
Wall Street struggled to make gains amid the AI bubble hype with the NASDAQ falling 0.2% while the S&P500 etched out a small 0.1% gain to close the week out at 6728 points.
The four hourly chart shows how this retracement headed back to the 6800 point level before stabilising. Short term resistance at the 6900 point level has firmed again here so watch for support at the 6700 point level to come under threat next:
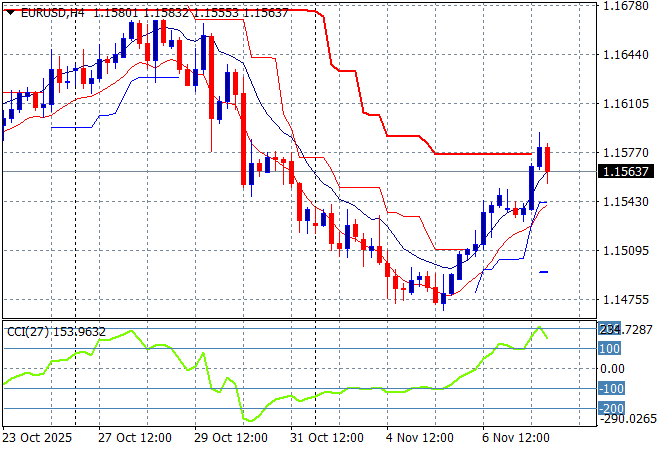
Currency markets are still reeling from the actions and words of the Fed meeting last week, which saw the USD eventually push back against everything after the December cut expectations were almost eliminated. Without the NFP, currency traders were left scratching their heads looking through very secondary US domestic data with Euro still trying to turn things around to get back above the 1.16 level.
The union currency had been building strength prior to the recent bad domestic economic news from the US overshadowed any continental slowdown but had reversed that trend in recent weeks. There is potential here to move back to the 1.17 level as the US shutdown grows worse:
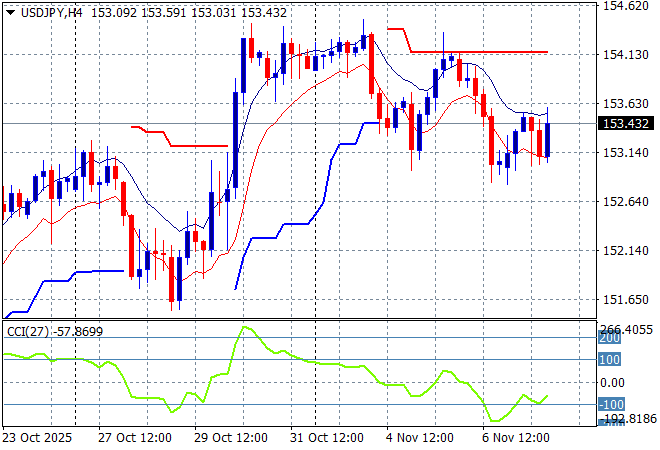
The USDJPY pair put in a consolidation phase before rallying on the Fed cut, which has now seen it surge up to the 154 level before some US weakness pulled everything back in line to steady below the mid 153 level on Friday night.
The previous price action was sending the pair beyond the March highs and had the potential to extend those gains through to start of year position at the 158 handle and this recent volatility is wanting to repeat this move:
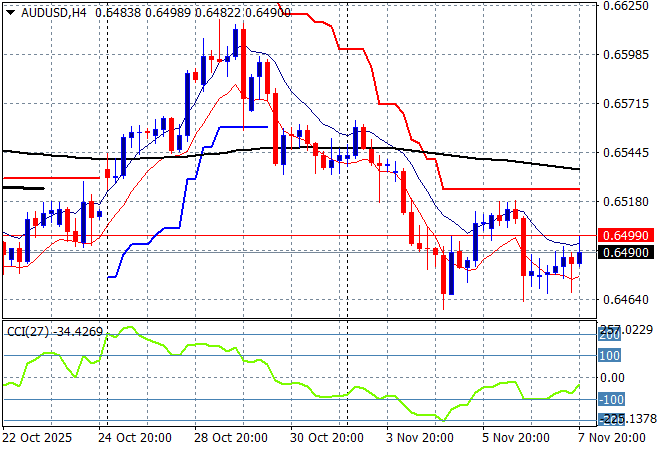
The Australian dollar had been on a breakout above the 65 cent level recently but last week’s Fed cut/wait approach saw it first blip above the 66 level briefly before slammed back to the mid 65 handle and then lower despite the hawkish hold-and-see from the RBA. Friday night saw only a little life return to the Pacific Peso as it almost touched the 65 handle again.
This could become a more sustained breakdown if the China/US trade war heats up as I’ve opined that the Pacific Peso is not out of trouble although I’m wary of a lot of volatility here, with a re-visit down to the 64 level not unlikely:
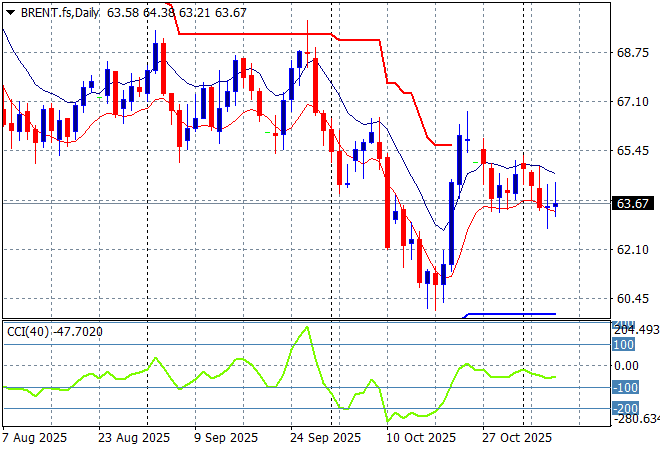
Oil markets have been trying to remain stabile but saw more overhead pressure on Friday night on a glut in US stocks with Brent crude still wanting to head down to the $63USD per barrel level.
The daily chart pattern shows the post New Year rally has a distant memory with any potential for a rally up to the $80 level completely dissipating. There was potential here for a run down to the $60 level next so watch for a follow through rollover here:
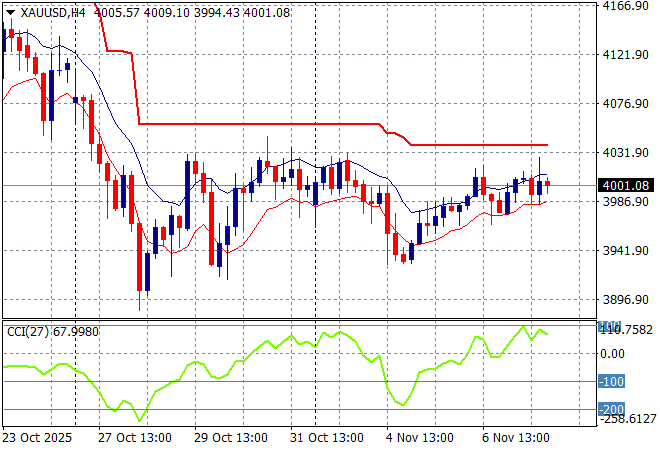
Gold was doing to better to stabilise after a well needed correction down towards the $3900USD per ounce level recently, but the current bounceback is still failing to really accelerate back above the $4000 area with only a modest lift on Friday night.
I noted a short term potential double top pattern forming here on the four hourly chart and that these falls could extend well below the $4000 level as ATR resistance firms here:
Glossary of Acronyms and Technical Analysis Terms:
ATR: Average True Range – measures the degree of price volatility averaged over a time period
ATR Support/Resistance: a ratcheting mechanism that follows price below/above a trend, that if breached shows above average volatility
CCI: Commodity Channel Index: a momentum reading that calculates current price away from the statistical mean or “typical” price to indicate overbought (far above the mean) or oversold (far below the mean)
Low/High Moving Average: rolling mean of prices in this case, the low and high for the day/hour which creates a band around the actual price movement
FOMC: Federal Open Market Committee, monthly meeting of Federal Reserve regarding monetary policy (setting interest rates)
DOE: US Department of Energy
Uncle Point: or stop loss point, a level at which you’ve clearly been wrong on your position, so cry uncle and get out/wrong on your position, so cry uncle and get out!