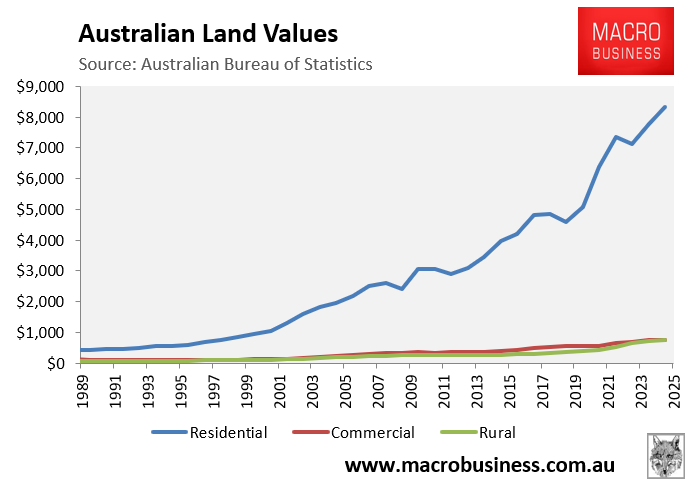
Last week, I reported on the latest annual national accounts from the Australian Bureau of Statistics (ABS), which showed that the total value of residential land in Australia increased by 7.0% during the 2024-25 financial year to a record $8.3 trillion.
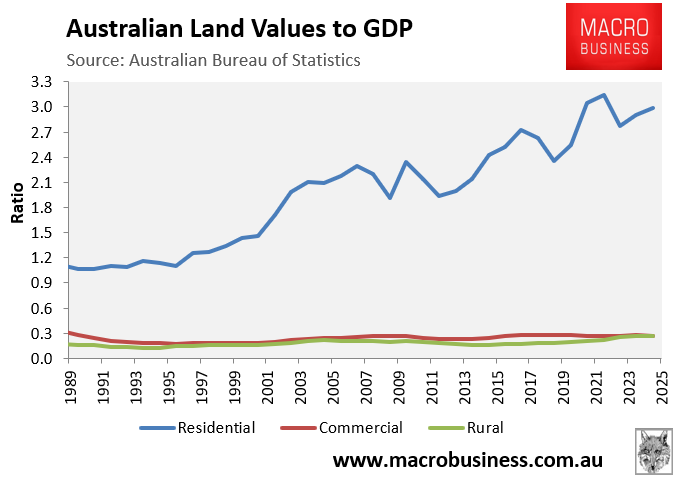
The next chart shows that total residential land values in Australia have skyrocketed from 1.1 times GDP in 1989 to 3.0 times GDP in 2024–25.
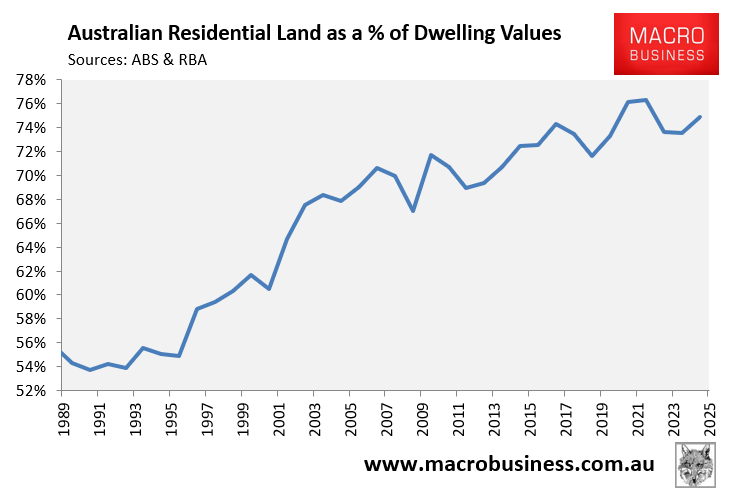
The land share of Australia’s housing stock has also increased from 54% in 1990-91 to 75% as of 2024-25.
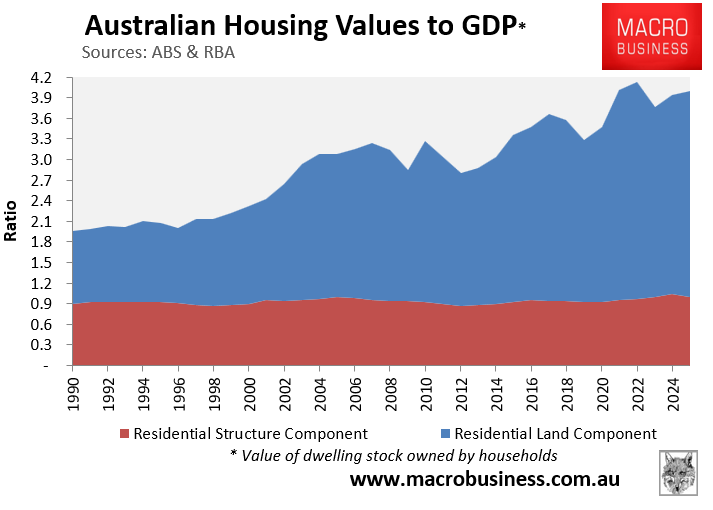
As a result, the total value of Australia’s housing stock—i.e., comprising land and buildings—was 4.0 times GDP as of 2024-25:
New data from Cotality and the Housing Industry Association (HIA) shows that lot prices nationally are rising by more than $200 a day, underpinning Australia’s housing affordability crisis.
In the 2024-25 financial year, median lot values nationally rose by 6.8%.
Over the decade to June 2025, values have surged across all capital cities, as illustrated below:
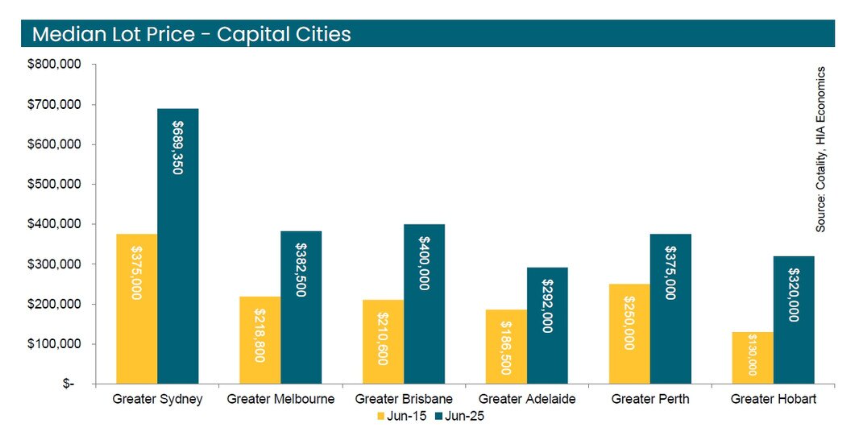
The decade increases in lot prices across the six state capitals are as follows:
- Greater Sydney: an increase of $314,350 (84%)
- Greater Melbourne: an increase of $163,700 (75%)
- Greater Brisbane: an increase of $189,400 (90%)
- Greater Adelaide: an increase of $105,500 (57%)
- Greater Perth: an increase of $125,000 (50%)
- Greater Hobart: an increase of $190,000 (146%)
The price of land per square metre has risen even faster as blocks have shrunk in size.
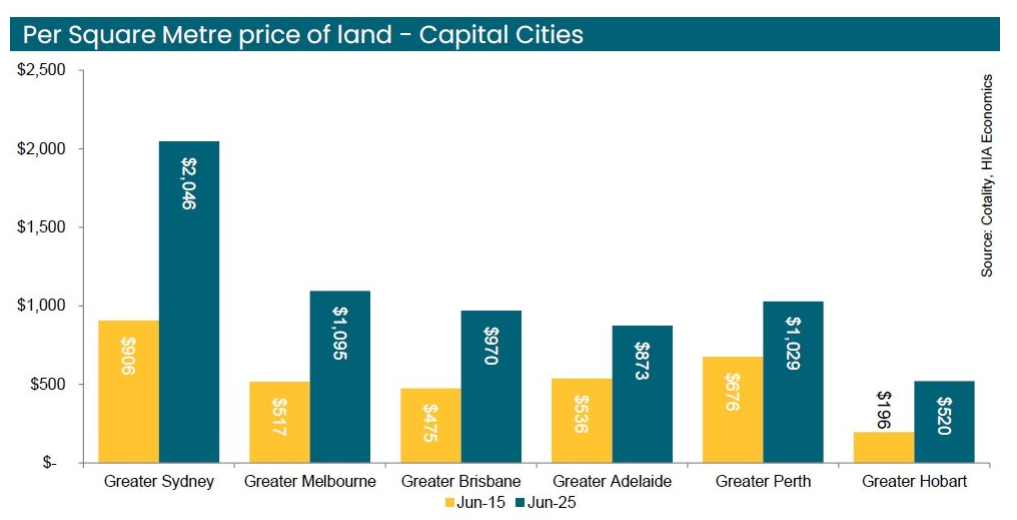
The decade increases in lot prices per square metre across the six state capitals are as follows:
- Greater Sydney: an increase of $1140 (126%)
- Greater Melbourne: an increase of $578 (112%)
- Greater Brisbane: an increase of $495 (104%)
- Greater Adelaide: an increase of $337 (63%)
- Greater Perth: an increase of $353 (52%)
- Greater Hobart: an increase of $324 (165%)
“Strong population dynamics have driven the strongest improvements in home building activity”, HIA chief economist Tim Reardon commented.
“Unfortunately, it is also producing some of the fastest increases in lot prices in the nation”.
The soaring cost of land is one of the major barriers to building homes for Australia’s rapidly growing population.
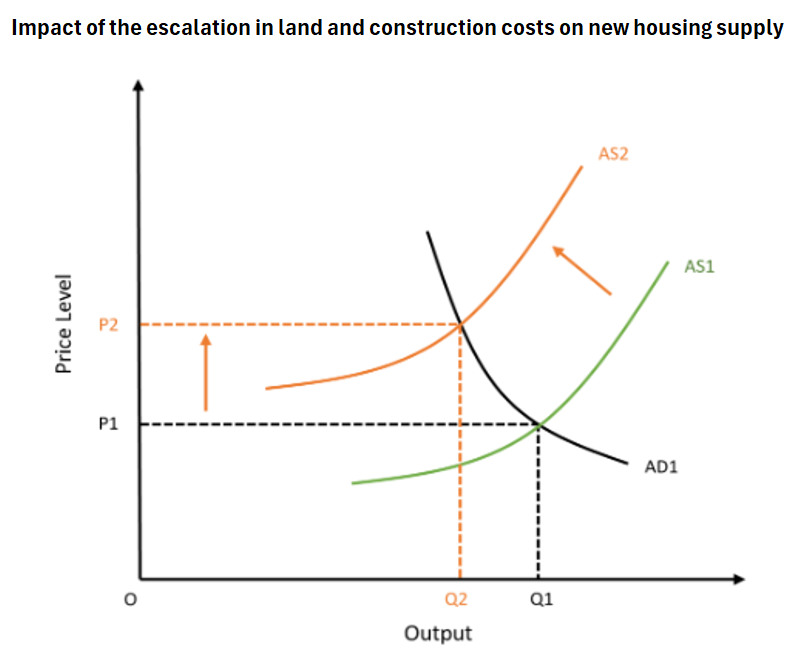
In economic terms, this hyperinflation of land costs has shifted the aggregate supply curve to the left, lowering the capacity to build dwellings at all price levels.
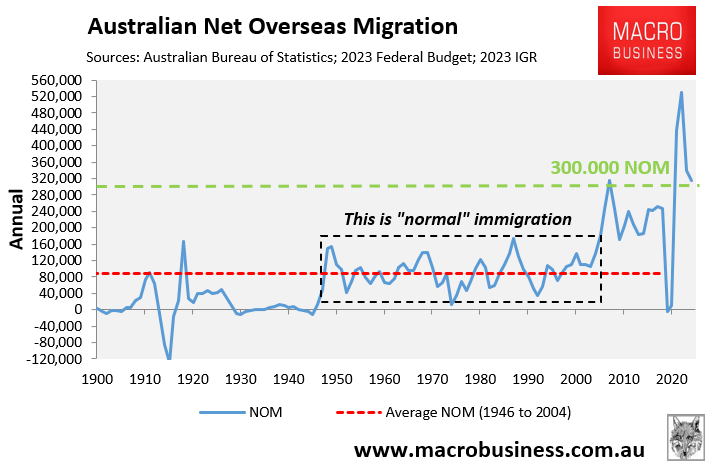
The federal government should have responded by reducing demand via lowering immigration. Instead, it chose to ramp immigration to record highs, driven by international students.
Indeed, Abul Rizvi last month forecast that net overseas migration will average an extraordinary 300,000 under current immigration policies.
The end result will be a worsening of Australia’s structural housing shortage.
