
Friday night saw the release of the latest inflation figures in the US which came in relatively soft given the tariff push on consumers and importers, but it opens the door for a probable “safe” cut from the Fed in its upcoming meeting. Further talks between the Xi and Trump regimes on rare earth exports look like going forward as ASEAN meets with risk markets likely to stay or increase their bullishness in this trading week. Unless the Mango Mussolini has another hissy fit like it did with Canada over an ad. Oil prices are still heading higher on more Ruzzian refinery setbacks and likely sanctions while the USD moved slightly lower against most of the majors except Pound Sterling. The Australian dollar managed to barely get back above the 65 cent level against USD but could find some life this week.
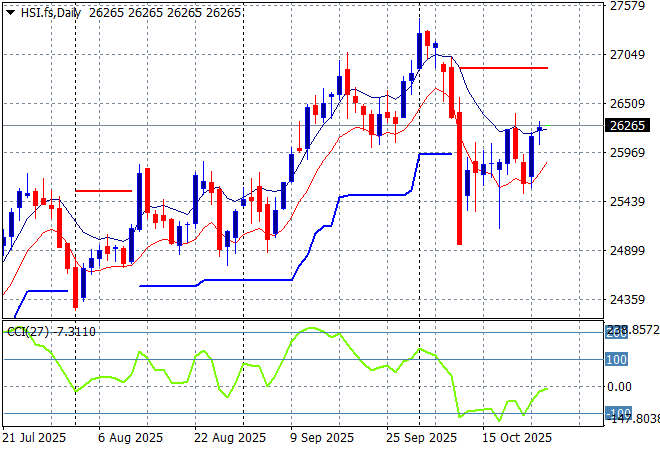
Looking at stock markets from Asia from Friday’s session, where mainland Chinese share markets lifted strongly going into the close with the Shanghai Composite finishing up more than 0.7% at 3950 points while the Hang Seng Index closed 0.6% higher at 26160 points.
The daily chart showed a complete fill of the March/April selloff and then some with a breakout above the 26000 point level looking like a sustained move here before the Trump tantrum. This selloff only takes out the gains in September but could spiral lower although is holding on well here as the TACO looks like coming back stronger:
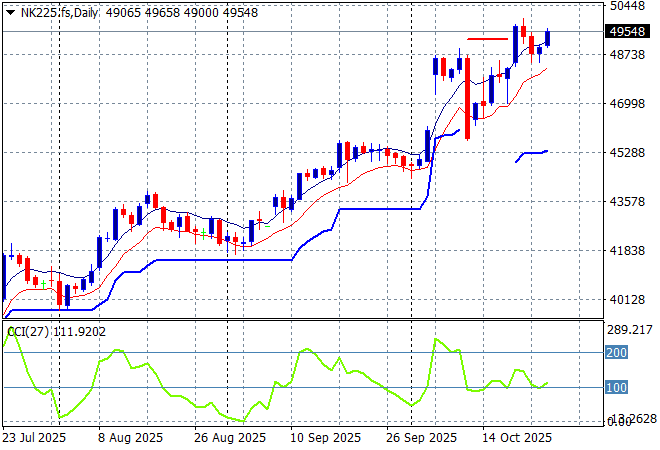
Japanese stock markets continued their rebound with the Nikkei 225 closing more than 1.3% higher at 49299 points.
Daily price action was looking extremely keen indeed as daily momentum accelerated after clearing resistance at the 42000 point level with another equity market that looks very stretched and breaking out a bit too strongly here. ATR support has been ratcheting up for awhile and could be upgraded to 46000 points proper in the short term as the 50000 point level looms:
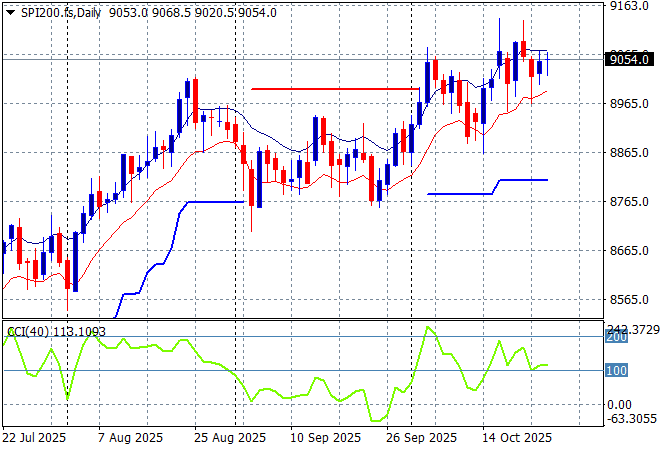
Australian stocks were the standout with the ASX200 actually alone in closing in negative territory finishing 0.1% lower at 9018 points. SPI futures however are up more than 0.3% due to the rally on Wall Street on Friday night.
The daily chart pattern was suggesting further upside still possible with a base built above the 8700 point level as daily momentum tried to maintain its overbought status. Short term support is holding on, supporting a wider rally:
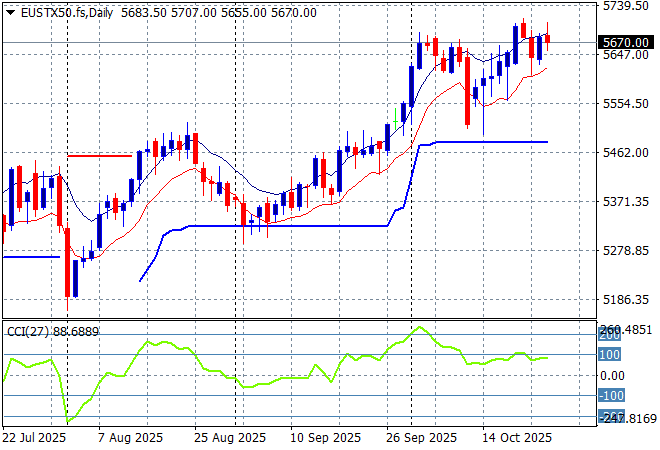
European markets were barely able to get back on track with some moves higher across the continent as the Eurostoxx 50 Index eventually closed just 0.1% higher to 5674 points.
Weekly support has been respected after a brief touch below the 5200 point level as the recent rebound on Euro weakness shows a complete fill. However the market was looking to make some good headway here despite the too high valuations (mainly defense stocks) with more upside potential building:
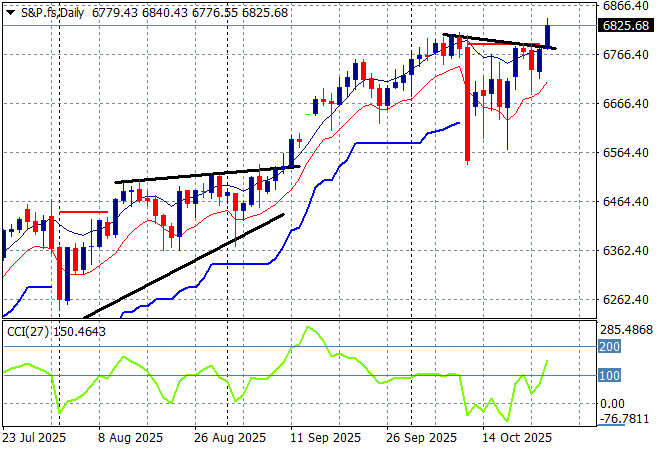
Wall Street surged back on strong earnings with tech stocks leading the way as the NASDAQ gained more than 1% while the S&P500 lifted just over 0.7% closing at the 6791 point level, causing a new breakout high.
The daily chart still looks like a stairway to heaven as all doors are open to this burgeoning AI and corporatist-fascist bubble as the latest CPI print proves tariffs are having little impact on inflation – so more interest rate cuts to blowoff asset prices are coming!
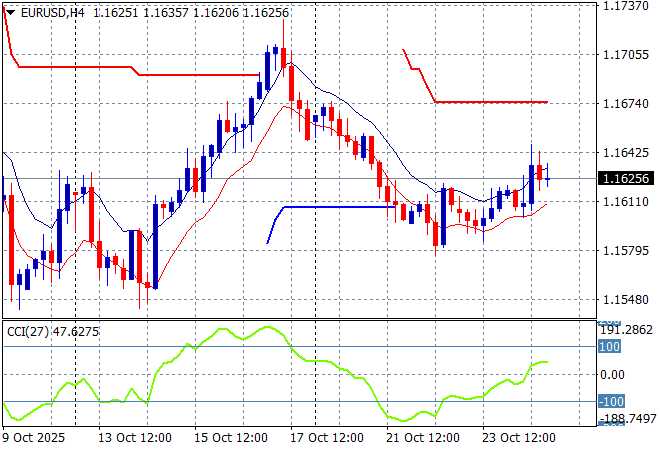
Currency markets are trying to swing away from recent USD strength and Friday’s US CPI print is giving the majors more buying support with Euro lifting above the 1.16 handle. Meanwhile the Canadian Loonie continued to firm as PM Carney makes more and more deals outside the US despite Trump’s dummy spit with USD while Pound Sterling fell back further.
The union currency had been building strength prior to the recent bad domestic economic news from the US overshadowed any continental slowdown but had reversed that trend in recent weeks. The potential breakout above the 1.17 level is getting more traction however momentum is not yet quite overbought:
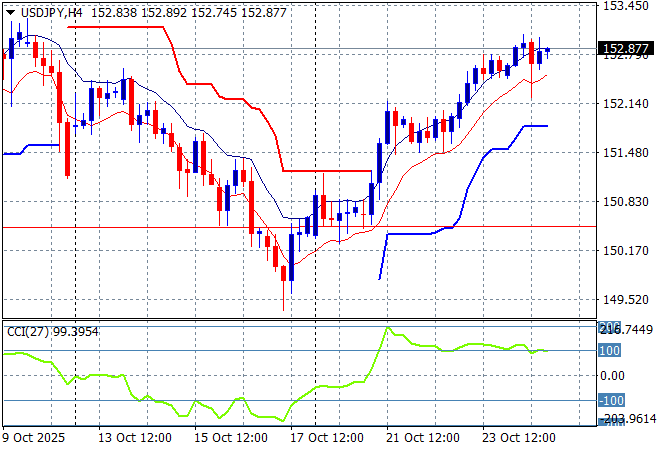
The USDJPY pair had been declining all last week following the Trump tariff tantrum on the previous Friday night, breaching the 150 level for a 300 pip move lower but it has put on a stunning reversal as the uber conservative new Japanese PM looks set to see Yen devalue from here. The pair finished the week just below the recent highs at the 153 level.
The previous price action was sending the pair beyond the March highs and had the potential to extend those gains through to start of year position at the 158 handle but the recent internal political volatility that looks resolved could see some steady trends build from here, but watch for any waning in overbought momentum readings:
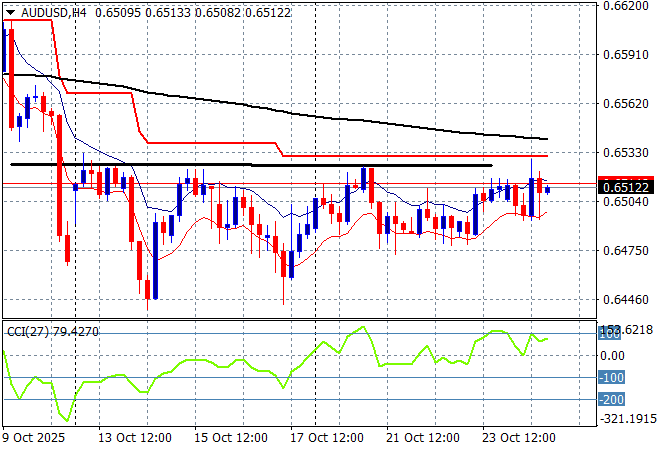
The Australian dollar continues to be under strain recently with the latest numberwang figures last week suggesting a potential November rate cut from the RBA which overshadowed what looks like multiple rate cuts from the Fed. This is keeping the Pacific Peso depressed around or slightly below the 65 handle but also could be building a base here for when the Fed does make it first cut.
This could become a more sustained breakdown if the China/US trade war heats up as I’ve opined that the Pacific Peso is not out of trouble although I’m wary of a lot of volatility here, but a short term double bottom pattern has been formed strongly on the four hourly and daily chart:
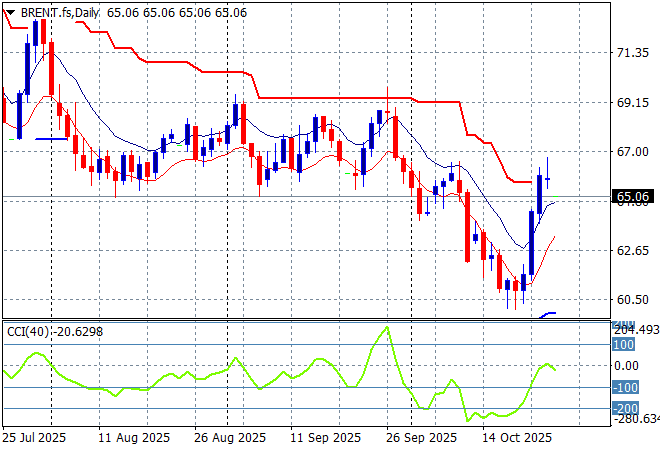
Oil markets have been failing to get any positive momentum going as both WTI and Brent crude remaining depressed but this have reversed due to the recent surprise drawdown in US oil supplies and the ongoing attacks on Ruzzian refineries amid further sanctions. This gave both markers a big lift higher last week with Brent continuing to push above the $65USD per barrel level.
The daily chart pattern shows the post New Year rally has a distant memory with any potential for a rally up to the $80 level completely dissipating. There was potential here for a run down to the $60 level next but wait and see if this one off bid turns into a trend:
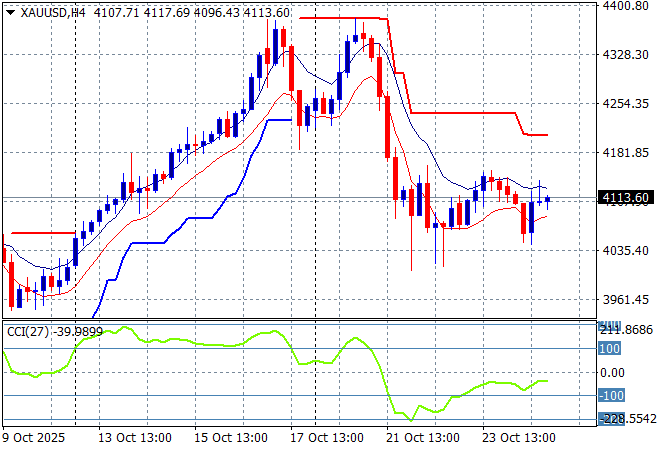
Gold is trying to stabilise after a well needed correction down towards the $4000USD per ounce level recently, and had some minor volatility over Friday’s CPI print as it continued to settle at the $4100 level.
This was looking very solid indeed as more central banks indicate more gold purchases and to be frank, confidence in the USD continues to crash but be wary of more downside volatility ahead this week. I noted a short term potential double top pattern forming here on the four hourly chart and these falls could extend down to the $4000 level or lower:
Glossary of Acronyms and Technical Analysis Terms:
ATR: Average True Range – measures the degree of price volatility averaged over a time period
ATR Support/Resistance: a ratcheting mechanism that follows price below/above a trend, that if breached shows above average volatility
CCI: Commodity Channel Index: a momentum reading that calculates current price away from the statistical mean or “typical” price to indicate overbought (far above the mean) or oversold (far below the mean)
Low/High Moving Average: rolling mean of prices in this case, the low and high for the day/hour which creates a band around the actual price movement
FOMC: Federal Open Market Committee, monthly meeting of Federal Reserve regarding monetary policy (setting interest rates)
DOE: US Department of Energy
Uncle Point: or stop loss point, a level at which you’ve clearly been wrong on your position, so cry uncle and get out/wrong on your position, so cry uncle and get out!