
Earnings on Wall Street failed to get things moving overnight amid a lack of other economic or macro catalysts with most risk markets returning scratch sessions or barely higher in the end. The standout however is USD which is pressuring Euro and the other major currency pairs even as the Trump regime holds the US federal government in shutdown mode. The speculative buying frenzy in gold has seen a solid reversal overnight as it lost more than $200 in a single session, falling back to the $4100USD per ounce level while the Australian dollar seems unable to get back above the 65 cent level against USD.
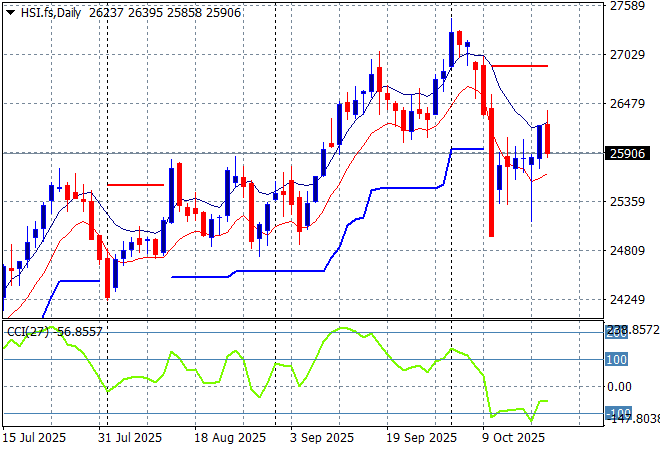
Looking at stock markets from Asia from yesterday’s session, where mainland Chinese share markets are bouncing back from their Friday falls with the Shanghai Composite up more than 1% at 3916 points while the Hang Seng Index is up more than 0.6% to crack the 26000 point level, extending their recent gains.
The daily chart showed a complete fill of the March/April selloff and then some with a breakout above the 26000 point level looking like a sustained move here before the Trump tantrum. This selloff only takes out the gains in September but could spiral lower although is holding on well here as the TACO looks like coming back stronger:
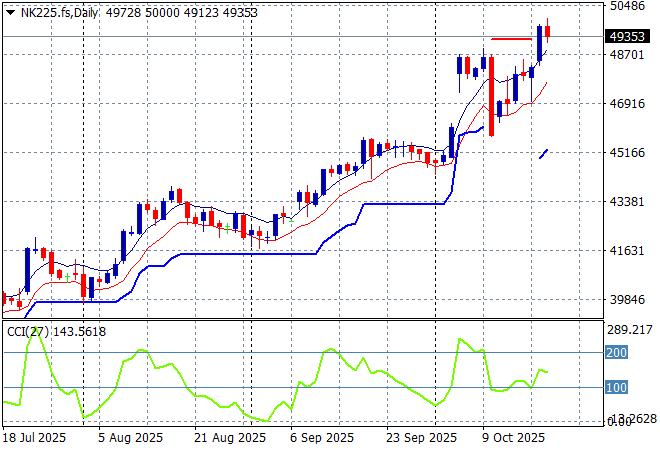
Japanese stock markets were still in rebound mode although they lost some momentum later in the session with the Nikkei 225 unable to close above the 50000 point level.
Daily price action was looking extremely keen indeed as daily momentum accelerated after clearing resistance at the 42000 point level with another equity market that looks very stretched and breaking out a bit too strongly here. ATR support has been ratcheting up for awhile and could be upgraded to 46000 points proper in the short term as the 50000 point level looms:
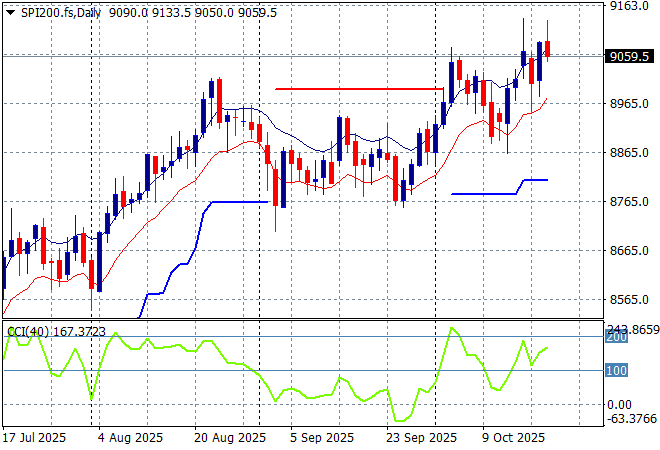
Australian stocks did well mainly due to rare earth miners on the Trump regime deal, with the ASX200 nearly 0.8% higher at 9094 points. SPI futures are down 0.5% however due to some wobbles on Wall Street’s overnight.
The daily chart pattern was suggesting further upside still possible with a base built above the 8700 point level as daily momentum tried to maintain its overbought status but so far short term support is holding on, supporting a wider rally:
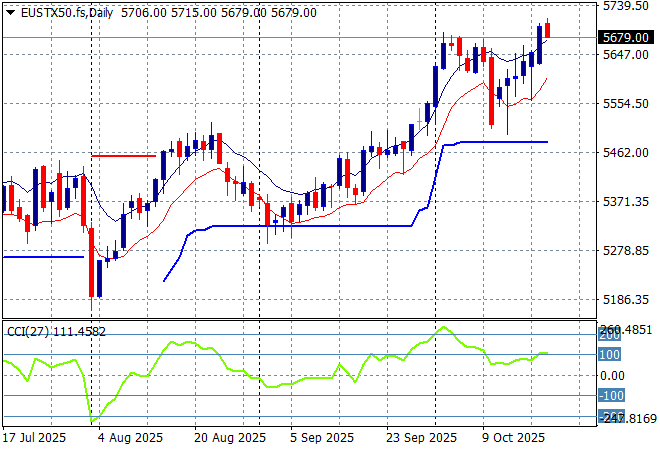
European markets saw some good moves across the continent but the Eurostoxx 50 Index eventually only closed 0.1% higher to 5686 points.
Weekly support has been respected after a brief touch below the 5200 point level as the recent rebound on Euro weakness shows a complete fill. However the market was looking to make some good headway here despite the too high valuations (mainly defense stocks) with more upside potential building:
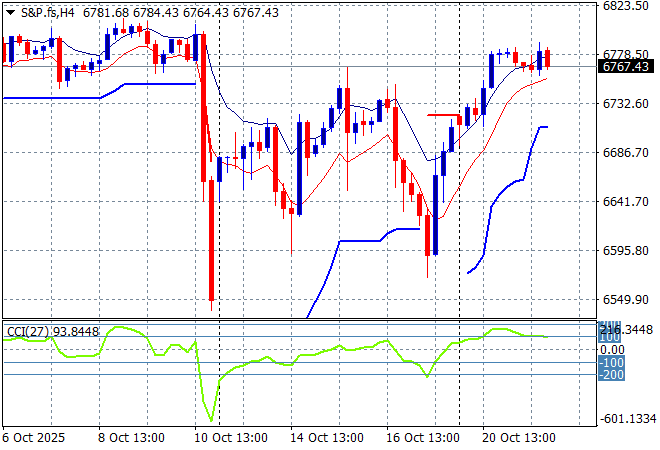
Wall Street started off strong but faltered later in the session with the NASDAQ and the S&P500 both treading water, the latter closing at the 6735 point level.
The daily chart still looks like a stairway to heaven but the swift return to the breakout point shows this market is actually quite fragile with supremely overvalued momentum. Are we looking at the last stages (which could last months or another year or until Trump TACO’s again) of this bubble:
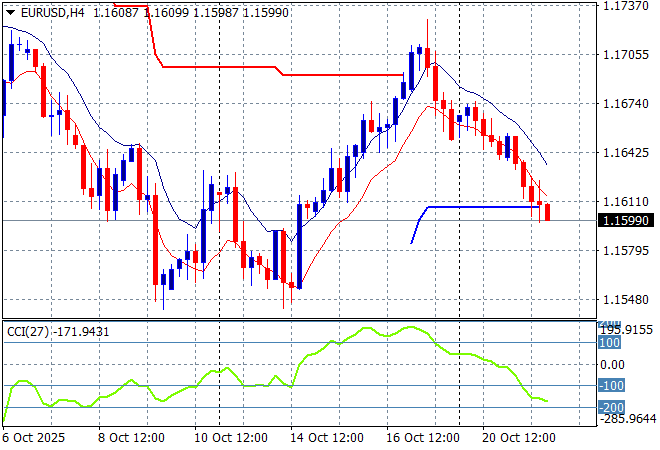
Currency markets had been pushing back against King Dollar for good reason as pressure mounts internally and externally on the US economy due to the government shutdown, burgeoning debt and ongoing trade war with China. However the mood is now totally back to positivity for the USD with Euro retracing below the mid 1.16 level while Pound Sterling rolled over further after being somewhat steady above the 1.34 level.
The union currency had been building strength prior to the recent bad domestic economic news from the US overshadowed any continental slowdown but had reversed that trend in recent weeks. The potential breakout above the 1.17 level is looking unlikely in the short term as momentum has retraced from being slightly overbought to properly oversold:
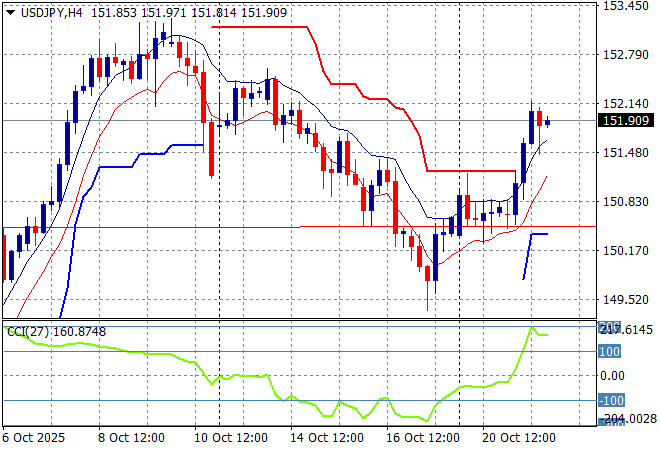
The USDJPY pair had been declining all last week following the Trump tariff tantrum on the previous Friday night, breaching the 150 level for a 300 pip move lower before a strong move amid a new PM saw it bounce up to the 152 level overnight.
The previous price action was sending the pair beyond the March highs and had the potential to extend those gains through to start of year position at the 158 handle but the recent internal political volatility that looks resolved could see some steady trends build from here:
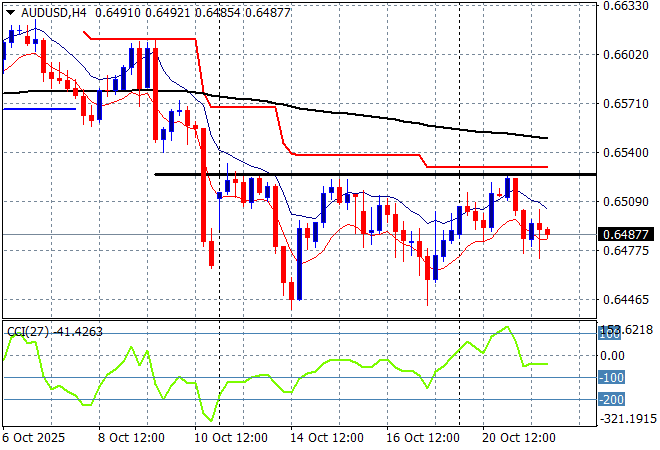
The Australian dollar has been under a lot of strain recently with the latest numberwang figures last week suggesting a potential November rate cut from the RBA which overshadowed what looks like multiple rate cuts from the Fed. Overnight however it failed again to get back above the 65 handle.
This could become a more sustained breakdown if the China/US trade war heats up as I’ve opined that the Pacific Peso is not out of trouble although I’m wary of a lot of volatility here, but a short term double bottom pattern has been formed on the four hourly chart:
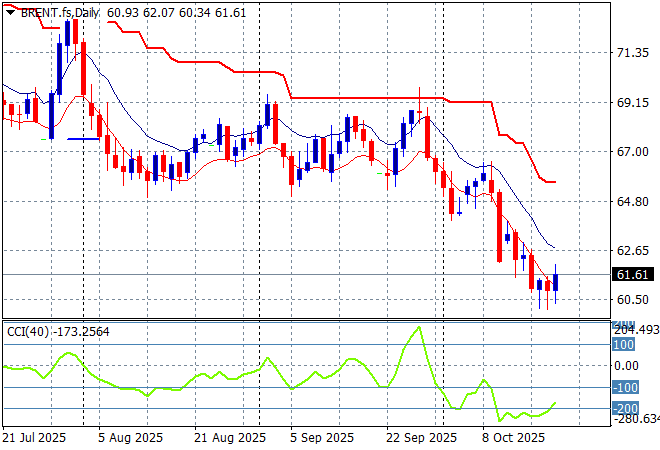
Oil markets have been failing to get any positive momentum going as both WTI and Brent crude remain depressed with the latter hovering around the $60USD per barrel level although it managed to not make another new daily low.
The daily chart pattern shows the post New Year rally has a distant memory with any potential for a rally up to the $80 level completely dissipating. There is potential here for a run down to the $60 level next:
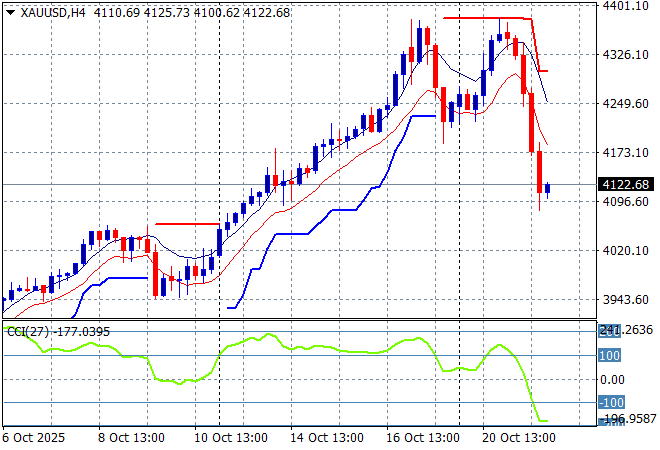
Gold wants to soar higher with a series of $100 plus gains in each session, punching through the $4400USD per ounce level last week before a $100 fall on Friday night but a failure to breach the previous high saw it collapse more than $200USD overnight, closing just above the $4100 level this morning.
This was looking very solid indeed as more central banks indicate more gold purchases and to be frank, confidence in the USD continues to crash but be wary of more downside volatility ahead this week. I noted a short term potential double top pattern forming here on the four hourly chart and these falls could extend down to the $4000 level or lower:
Glossary of Acronyms and Technical Analysis Terms:
ATR: Average True Range – measures the degree of price volatility averaged over a time period
ATR Support/Resistance: a ratcheting mechanism that follows price below/above a trend, that if breached shows above average volatility
CCI: Commodity Channel Index: a momentum reading that calculates current price away from the statistical mean or “typical” price to indicate overbought (far above the mean) or oversold (far below the mean)
Low/High Moving Average: rolling mean of prices in this case, the low and high for the day/hour which creates a band around the actual price movement
FOMC: Federal Open Market Committee, monthly meeting of Federal Reserve regarding monetary policy (setting interest rates)
DOE: US Department of Energy
Uncle Point: or stop loss point, a level at which you’ve clearly been wrong on your position, so cry uncle and get out/wrong on your position, so cry uncle and get out!