
Friday night saw a selloff dominate on risk markets as the end of week and month double twitching and fund flows amid the steepening yield curve on US Treasuries, now at a three year high. Wall Street pulled back the sharpest with European shares still in hesitation mode. The USD was broadly unchanged but finishes the month much lower against almost everything as the Australian dollar did well almost getting back to its previous monthly high at the mid 65 cent level.
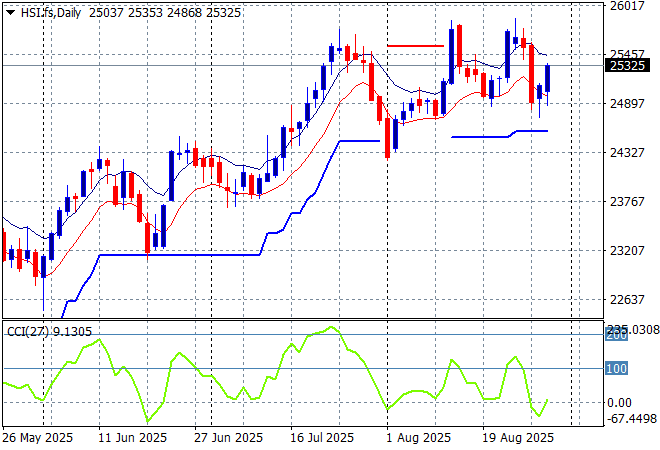
Looking at stock markets from Asia from Friday’s session, where mainland Chinese share markets were able to hold on to some meagre gains into the close with the Shanghai Composite up just 0.3% to stay above the 3800 point level while the Hang Seng Index fought back to also close 0.3% higher to return above the 25000 point level.
The daily chart shows a complete fill of the March/April selloff with momentum reversing back into overbought territory to try get back to its recent highs. Resistance at the 25000 point level has turned into a breakout play here with support at the 24000 point level as the springboard but this short term reversal is taking a lot of heat out of the market:
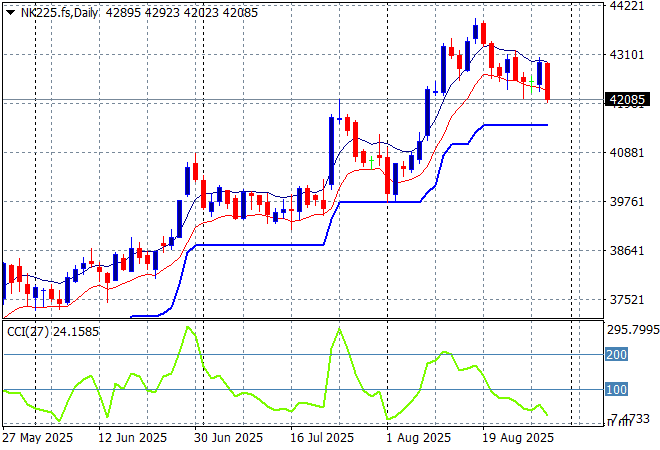
Japanese stock markets pulled back slightly with the Nikkei 225 down 0.3% at 42718 points, unable to make a new weekly high.
Daily price action was looking very keen indeed as daily momentum has accelerated after clearing resistance at the 36000 point level with another equity market that looks very stretched and breaking out a bit too strongly here. ATR support has been ratcheting up for awhile but is now pausing:
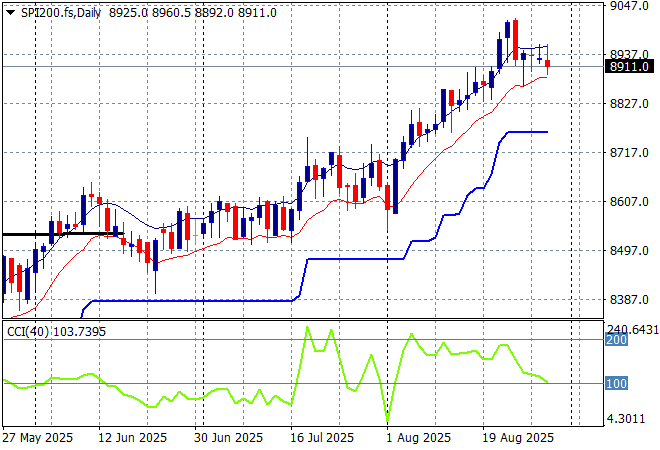
Australian stocks were treading water with the ASX200 closing just below the 9000 point level. SPI futures are off only 0.3% or so despite the broader losses on Wall Street on Friday night as we start a new month.
The daily chart pattern is suggesting further upside still possible with a base built above the 8500 point level as daily momentum has maintained its overbought status but watch for some attempt at selling here as local support wanes:
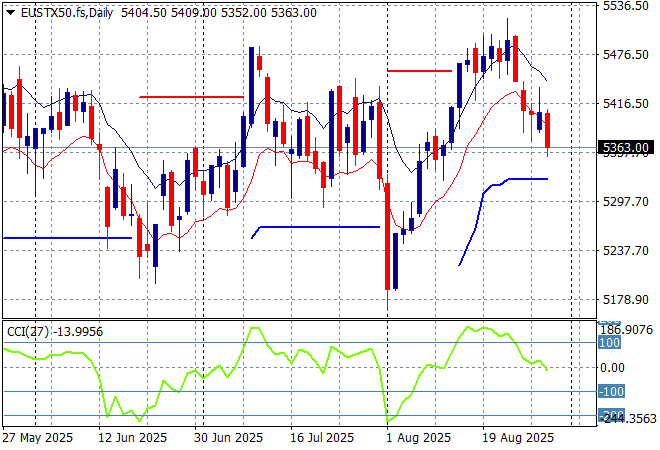
European markets were pushed down with broader losses across the continent eventually sending the Eurostoxx 50 Index down 0.8% to close the week at 5351 points.
Weekly support has been respected after a brief touch below the 5200 point level as the recent rebound on Euro weakness shows a complete fill. However this market is beginning to lose steam yet again with the recent falls taking out short term support:
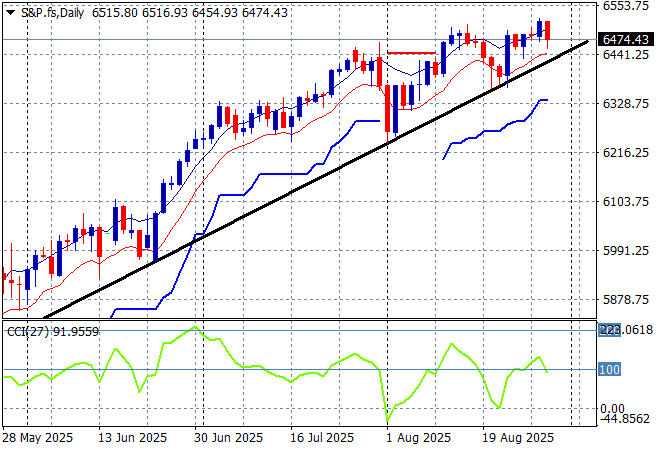
Wall Street also stumbled and then sold off quicker into the close with the NASDAQ finishing more than 1% lower while the S&P500 pulled back from the 6500 point barrier to close 0.6% lower at 6460 points.
The daily chart still looks like a stairway to heaven while the four hourly chart shows the 6500 point barrier becoming a little too high to overcome as short term momentum wants to get back into overbought mode. I’m watching for a potential repositioning as this is a long weekend after the end of week/month twitching:
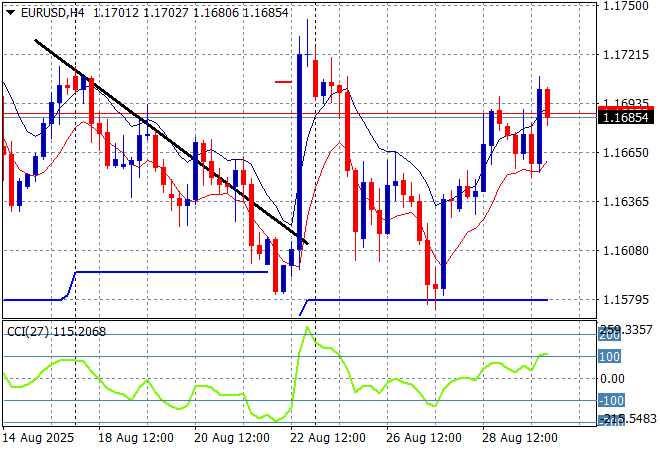
Currency markets continue to get back to their pre-Jackson Hole positions against “King” dollar despite some solid US data during the week with concern over the exploding US fiscal position and the loss of independence at the Federal Reserve overshadowing everything. Compounding this is the weekend news that the Trump regimes tariffs have been ruled as illegal – not that that means anything in the “land of the free” anymore. Euro lead the way again as it pushed back towards the 1.17 level on Friday night.
The union currency had been building strength continuously as bad domestic economic news from the US overshadowed any continental slowdown but had reversed that trend in recent weeks. Short term momentum was suggesting a proper rout with a new weekly low at the 1.14 handle, having lost more than 100 pips since the start of the trading week, but weekly support held fire before the Friday night reversal:
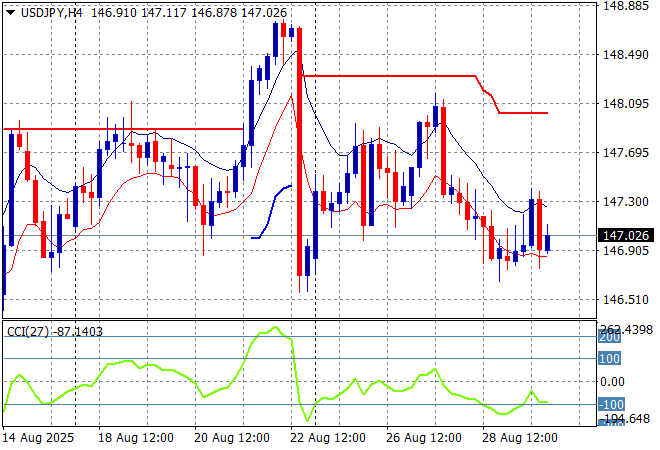
The USDJPY pair is heading back to its post Jackson Hole position as Yen strengthens against USD despite talk of a potential trade deal/deal with a break back down to the 147 level on Friday night.
The previous price action was sending the pair beyond the March highs and had the potential to extend those gains through to start of year position at the 158 handle but the jobs surprise puts this all on the backburner. USD weakness is going to weigh on Yen for awhile here so watch for a potential breakdown to the 146 handle next:
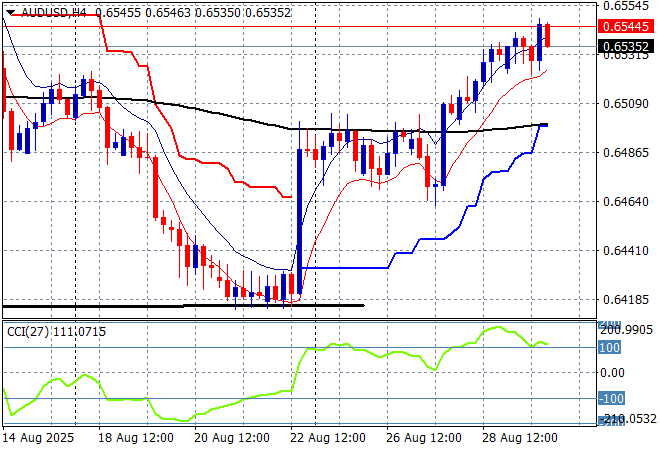
The Australian dollar has been largely unchanged by the recent but well expected RBA cut and despite a poor CAPEX print last week the Pacific Peso is building more support as it pushed above the 65 cent level again on Friday night.
Keep an eye on temporary support at the 63 cent level and also the series of lower highs in recent weeks of signs of less internal support, as there is potential for a further rollover if Fed signalling does not become more dovish, with weekly support still under a lot of pressure:
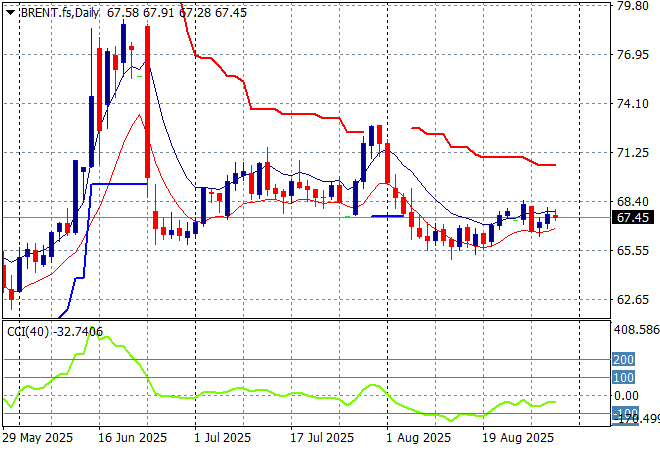
Oil markets are trying hard to get positive momentum going as both WTI and Brent crude stabilized further on Friday with the latter staying above the $67USD per barrel level after being stuck around the $66USD area for so long.
The daily chart pattern shows the post New Year rally that got a little out of hand and now reverting back to the sideways lower action for the latter half of 2024. The potential for a rally up to the $80 level after making new substantive daily highs was gaining traction but needs a lot more support in the short term:
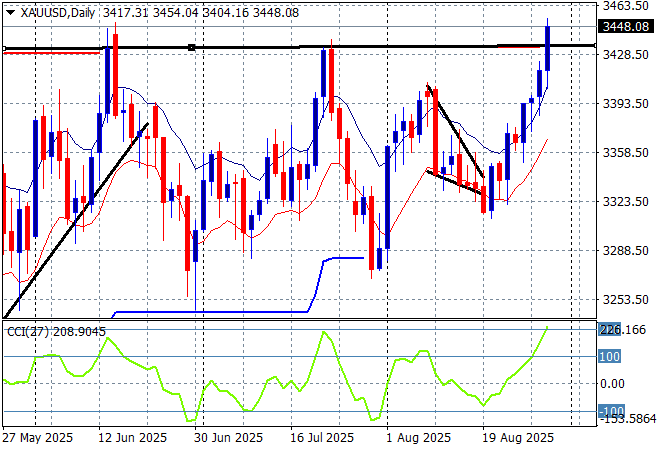
Gold had been failing to revive its recent bounceback as it flopped down towards the $3300USD per ounce level in previous sessions but is looking much stronger now as it matches the previous record highs on the daily and weekly charts. Friday night saw it burst through to the $3450 zone.
Short term support had been under threat most of the last three weeks with price almost returning to the late June lows as the USD gained strength. Daily momentum was getting back into the positive zone, as support was being somewhat built but that series of new lows was too telling. This is looking like a solid reversal with a lot of internal buying support in the short term:
Glossary of Acronyms and Technical Analysis Terms:
ATR: Average True Range – measures the degree of price volatility averaged over a time period
ATR Support/Resistance: a ratcheting mechanism that follows price below/above a trend, that if breached shows above average volatility
CCI: Commodity Channel Index: a momentum reading that calculates current price away from the statistical mean or “typical” price to indicate overbought (far above the mean) or oversold (far below the mean)
Low/High Moving Average: rolling mean of prices in this case, the low and high for the day/hour which creates a band around the actual price movement
FOMC: Federal Open Market Committee, monthly meeting of Federal Reserve regarding monetary policy (setting interest rates)
DOE: US Department of Energy
Uncle Point: or stop loss point, a level at which you’ve clearly been wrong on your position, so cry uncle and get out/wrong on your position, so cry uncle and get out!