
This time an inflation print actually got traders worried on Wall Street with the latest US PPI coming in hot overnight showing that the tariff “push” is slowing coming through the US economy. The USD got off the ropes against all the majors, pushing most of them down with rollovers as Euro lost more than 50 pips to the mid 1.16 handle and gold suffering as well. A small blip higher in oil saw Brent crude steady near the $67USD per barrel level while the Australian dollar is losing its recent resilience with a flop below the 65 handle. Meanwhile Treasury yields jumped higher across the curve as interest rate cut expectations were pulled back for the September meeting.
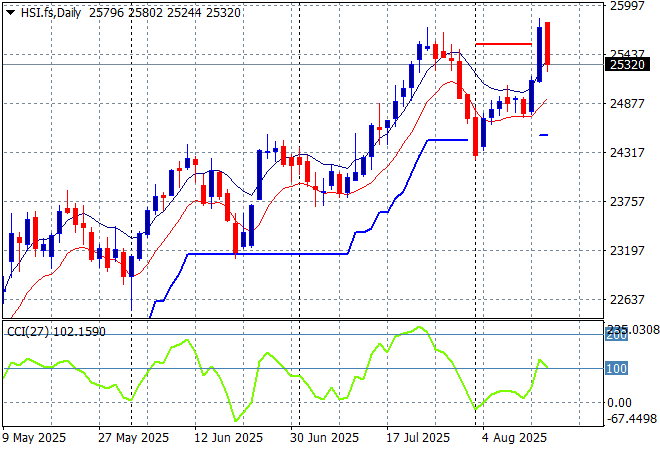
Looking at stock markets from Asia from yesterday’s session, where mainland Chinese share markets fell over into the close with the Shanghai Composite down nearly 0.5% but still well above the 3600 point level while the Hang Seng Index is playing along, down 0.3% to remain just above 25500 points.
The daily chart shows a complete fill of the March/April selloff with momentum reversing after failing to make new highs. Resistance at the 25000 point level has turned into a breakout play here with support at the 24000 point level as the springboard:
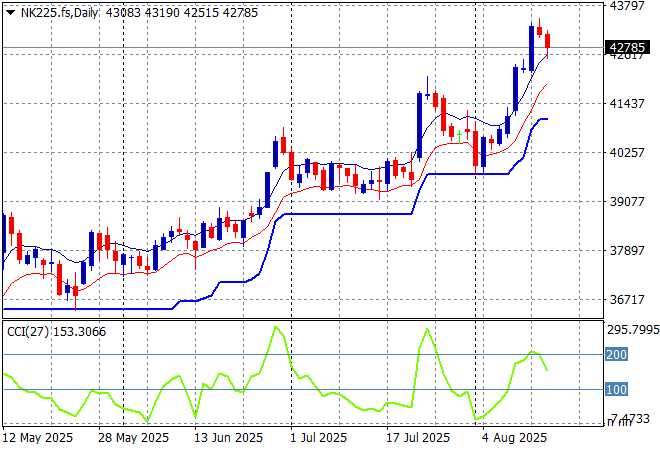
Japanese stock markets also saw a strong selloff on the stronger Yen with the Nikkei 225 losing more than 1.3% to close at 42639 points.
Daily price action was looking very keen indeed as daily momentum has accelerated after clearing resistance at the 36000 point level with another equity market that looks very stretched and breaking out a bit too strongly here. ATR support has been ratcheting up for awhile but is not stopping:
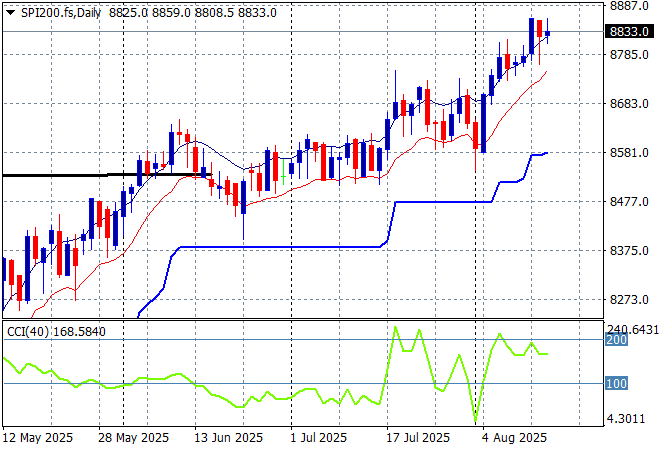
Australian stocks were the best performers again this time due to the strong unemployment print with the ASX200 lifting more than 0.5% to 8873 points. SPI futures are up slightly despite the lack of a strong lead from Wall Street overnight.
The daily chart pattern is suggesting further upside still possible with a base built above the 8500 point level as daily momentum has regained its overbought status:
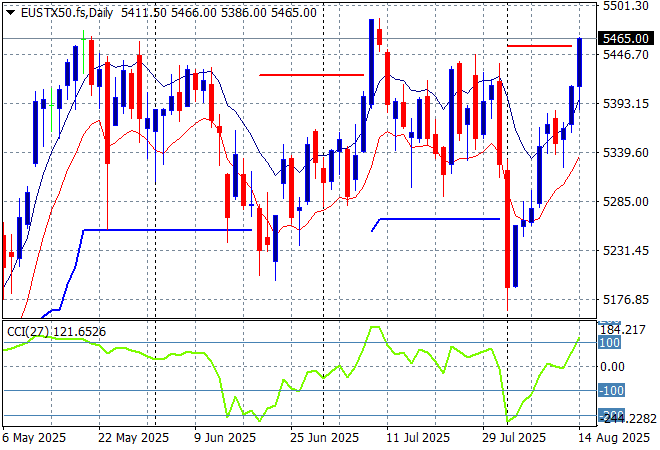
European markets continued to rise as confidence returned across the continent with the Eurostoxx 50 Index closing 0.8% higher overnight to finish at 5434 points.
Weekly support hadn’t moved in a few months but has now been decisively breached, with the market unable to push any further above the pre “Liberation Day” highs. There could be daylight below but momentum was quite oversold so this might be overdone as this rebound shows:
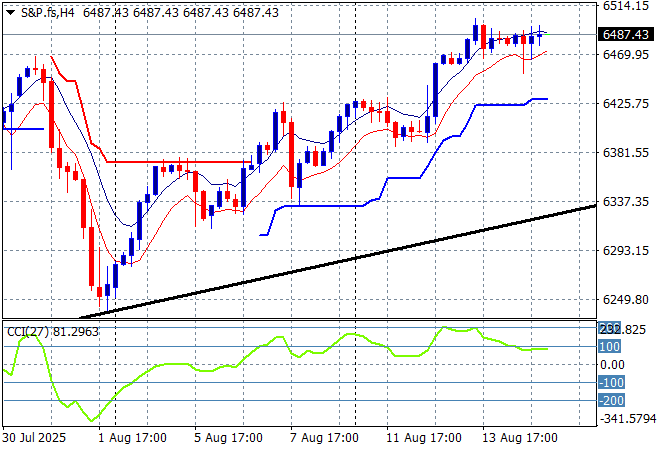
Wall Street however was unable to eke out new record highs again although it was close with the NASDAQ down just 0.1% while the S&P500 finished only 1 point higher at 6467 points.
The daily chart still looks like a stairway to heaven with the 6500 point barrier coming up very fast again as short term momentum remains nearly overbought:
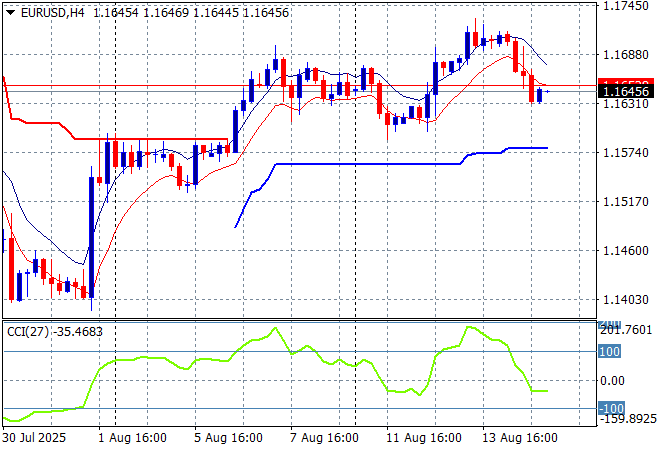
Currency markets have been against USD all week following a succession of poor US domestic economic prints with the latest headline CPI print absorbed but this time the PPI print came in a little too hot for expectations with King Dollar gaining strength all round. Euro and Pound Sterling were pushed lower with the former pulling well back from the 1.17 handle proper overnight, but still at the start of week position at the mid 1.16 handle.
The union currency had been building strength continuously as bad domestic economic news from the US overshadowed any continental slowdown but had reversed that trend in recent weeks. Short term momentum was suggesting a proper rout with a new weekly low at the 1.14 handle but this is a strong reversal that may have more upside:
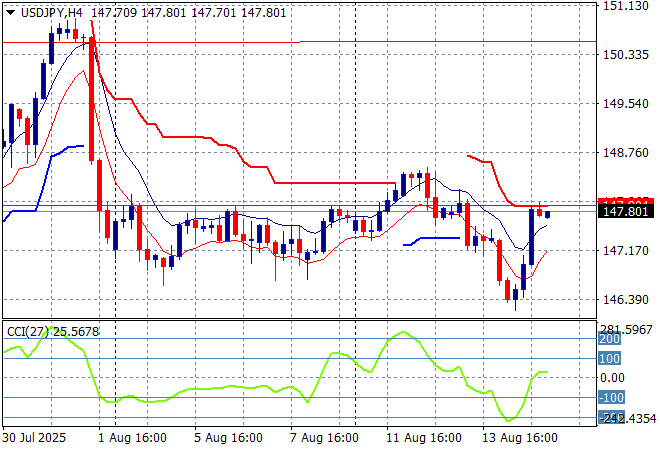
The USDJPY pair conversely had been getting pushed down on temporary Yen weakness following the Japan/US trade “deal”and USD weakness around the CPI print, but belated comments by the Trump regime about how the BOJ should raise rates saw Yen fall back and send the pair back towards the 148 level.
The previous price action was sending the pair beyond the March highs and had the potential to extend those gains through to start of year position at the 158 handle but the jobs surprise puts this all on the backburner. There could be another attempt here to get back to the 150 handle in the short term however:
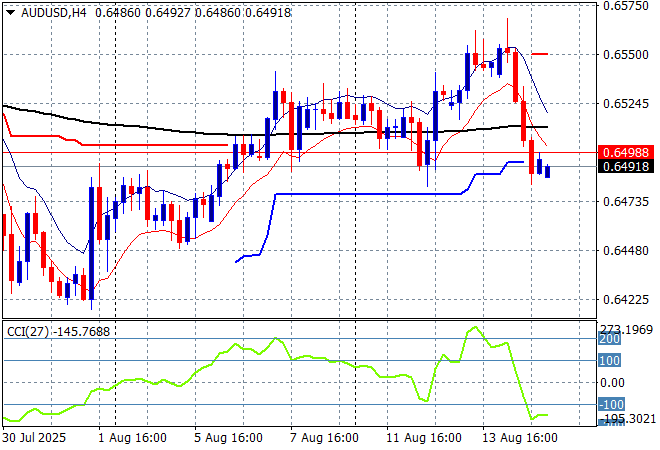
The Australian dollar was largely unchanged by the recent but well expected RBA cut where it held above the 65 handle but was pushed higher following the US CPI print but it couldn’t escape the reaction to the hot PPI print and has pulled back below that level.
Keep an eye on temporary support at the 63 cent level and also the series of lower highs in recent weeks of signs of less internal support, as there is potential for a rollover if Fed signalling does not become more dovish, with weekly support about to be taken out.
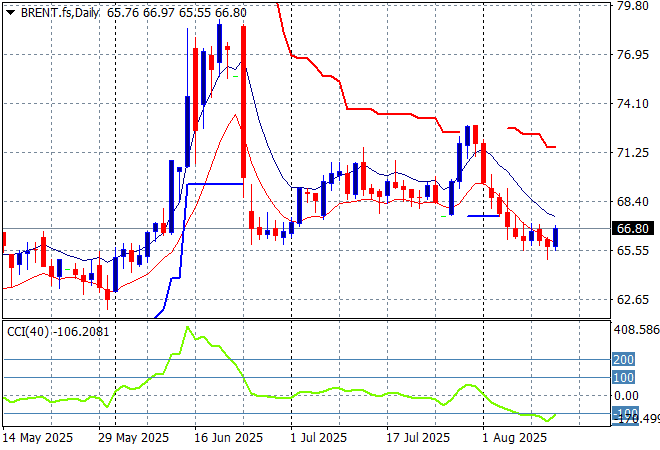
Oil markets tried better to stabilise overnight with Brent crude pushed nearly back to the $67USD per barrel level after recently making new weekly lows, lacking any upside momentum.
The daily chart pattern shows the post New Year rally that got a little out of hand and now reverting back to the sideways lower action for the latter half of 2024. The potential for a rally up to the $80 level after making new substantive daily highs was gaining traction but needs a lot more support in the short term:
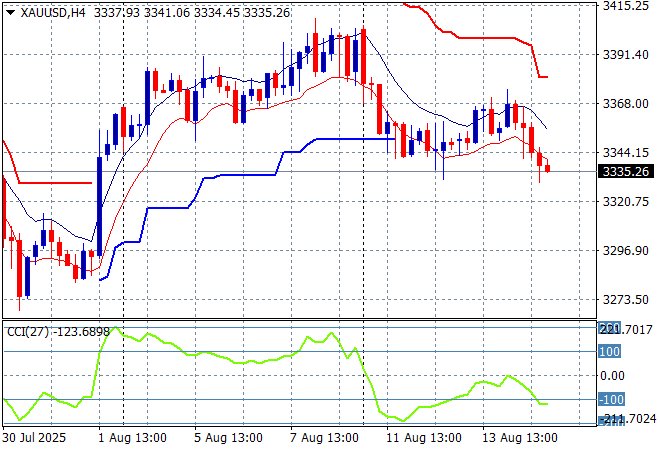
Gold is still failing to revive its recent bounceback as it holds well below the $3400USD per ounce level, largely unchanged by the CPI print but this time pushed down on the PPI print like other undollars as it closes around the $3330 level overnight for a new weekly low.
Short term support had been under threat most of the last three weeks with price almost returning to the late June lows as the USD gained strength. Daily momentum was getting back into the positive zone, as support was being built but the life has gone out of this recent rally:
Glossary of Acronyms and Technical Analysis Terms:
ATR: Average True Range – measures the degree of price volatility averaged over a time period
ATR Support/Resistance: a ratcheting mechanism that follows price below/above a trend, that if breached shows above average volatility
CCI: Commodity Channel Index: a momentum reading that calculates current price away from the statistical mean or “typical” price to indicate overbought (far above the mean) or oversold (far below the mean)
Low/High Moving Average: rolling mean of prices in this case, the low and high for the day/hour which creates a band around the actual price movement
FOMC: Federal Open Market Committee, monthly meeting of Federal Reserve regarding monetary policy (setting interest rates)
DOE: US Department of Energy
Uncle Point: or stop loss point, a level at which you’ve clearly been wrong on your position, so cry uncle and get out/wrong on your position, so cry uncle and get out!