
Well that was an interesting Friday night with the much anticipated non-farm payroll AKA US unemployment print shocking to the downside, with further revisions to prior month prints finally revealing the impact of the Trump regime’s tariff on the domestic economy. Coupled with the passing of the August 1st tariff “deadline” and King Trump spitting the dummy by firing the actual BLS statisticians over the job numbers amid the usual geopolitical imbroglios, it was a volatile session with Wall Street down nearly 2% across the board and European stocks off by nearly 3%. The USD reversed its recent strength with the Fed more likely to cut rates much sooner than expected on the rising unemployment but also cautious of rising inflation. Meanwhile US Treasuries all saw sharp drops in yields with the 10 year down to 4.2%, the lowest since the end of April.
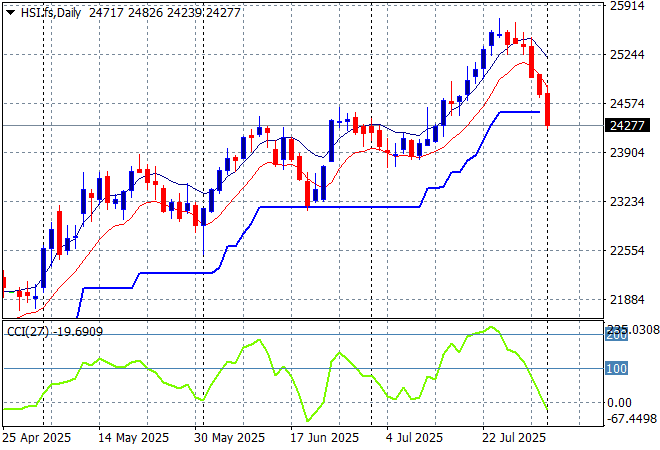
Looking at stock markets from Asia from Friday’s session, where mainland Chinese share markets were down slightly with the Shanghai Composite closing 0.4% lower to 3559 points while the Hang Seng Index lost another 1% to heavily retreat below the 25000 point level, capping off a pretty poor trading week.
The daily chart shows a complete fill of the March/April selloff with momentum reversing after failing to make new highs. Resistance at the 25000 point level has turn3d into a reversal here with support coming up at just below the 24000 point level soon:
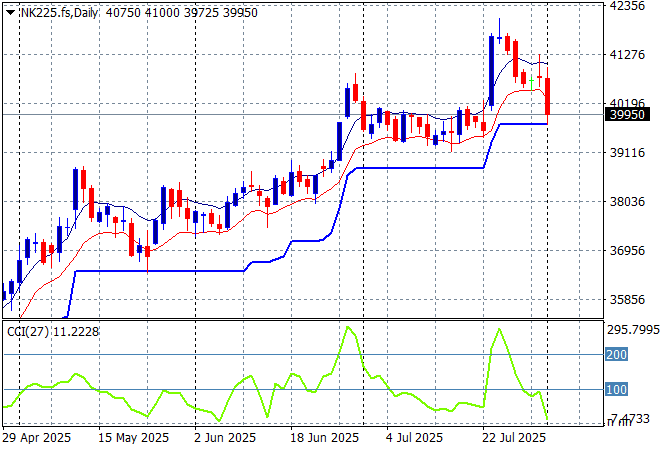
Japanese stock markets were also unable to make gains with the Nikkei 225 pushed more than 0.5% lower to close at 40799 points.
Daily price action was looking very keen indeed as daily momentum has accelerated after clearing resistance at the 36000 point level with another equity market that looks very stretched and breaking out a bit too strongly here. ATR support has been ratcheting up for awhile but the potential for a pullback is building:
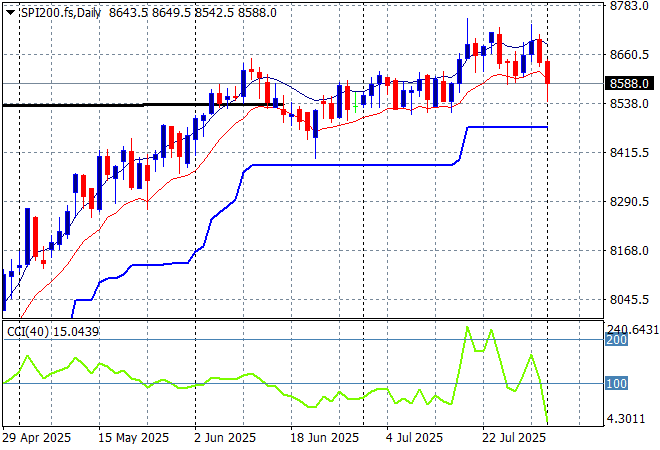
Australian stocks were also in reversal mode with the ASX200 closing 1% lower to retrace well below the 8700 point level and close the week out at 8662 points. SPI futures are down at least 0.4% due to the reaction to the NFP print on Wall Street from Friday night.
The daily chart pattern was suggesting further upside still possible with a base built above the 8500 point level but daily momentum has eased off from its overbought status and could reverse quickly here:
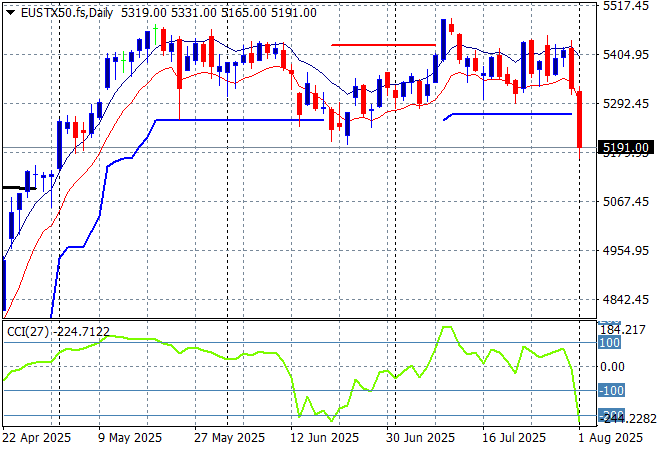
European markets sold off very sharply following the August 1st deadline with all bourses lower across the continent sending the Eurostoxx 50 Index down nearly 3% to finish at 5165 points.
Weekly support hadn’t moved in a few months but has now been decisively breached, with the market unable to get push any further above the pre “Liberation Day” highs and now react sharply to Trumpian volatility. There could be daylight below but momentum does seem quite oversold so this might be overdone:
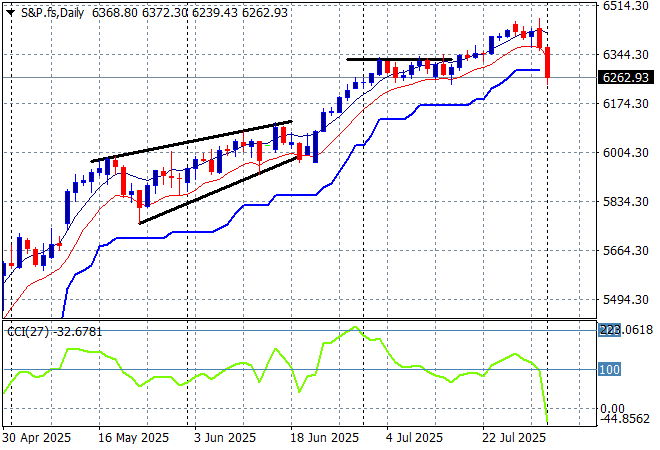
Wall Street did not like the NFP print or the revisions or King Trump’s spitting the dummy reaction with the NASDAQ losing more than 2% while the S&P500 was pushed 1.6% lower to close at 6238 points.
The four hourly chart was looking confused with recent support at the 6200 point level coming under pressure before resistance at the 6350 point level was taken out as more record highs were made. However ATR support on the daily chart has been clearly broken here taking out all of the previous month’s gains with price action not looking pretty here as the market guns for a rate cut ASAP please and thankyou:
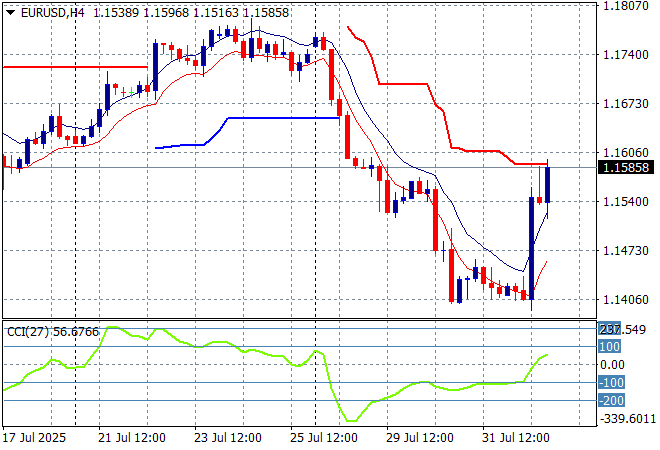
Currency markets were pushing USD higher in the wake of the recent Federal Reserve meeting but lost significant ground as the NFP came through and also on the lower ISM manufacturing print. Euro soared nearly 200 pips higher to almost get back above the 1.16 level after finding strong support at the 1.14 handle proper.
The union currency had been building strength continuously as bad domestic economic news from the US overshadowed any continental slowdown but had reversed that trend in recent weeks. Short term momentum was suggesting a proper rout with a new weekly low at the 1.14 handle but this is a strong reversal that may have more upside:
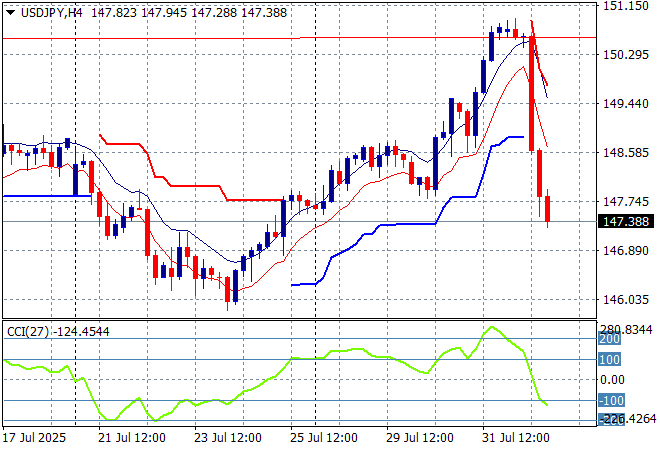
The USDJPY pair of course lost even more ground in reversal mode, heading 300 pips lower on the jobs print to wiped out all of the last week’s gains, finishing at just above the 147 level after only recently making a new monthly high at the 150 level.
The previous price action was sending the pair beyond the March highs and had the potential to extend those gains through to start of year position at the 158 handle but the jobs surprise puts this all on the backburner:
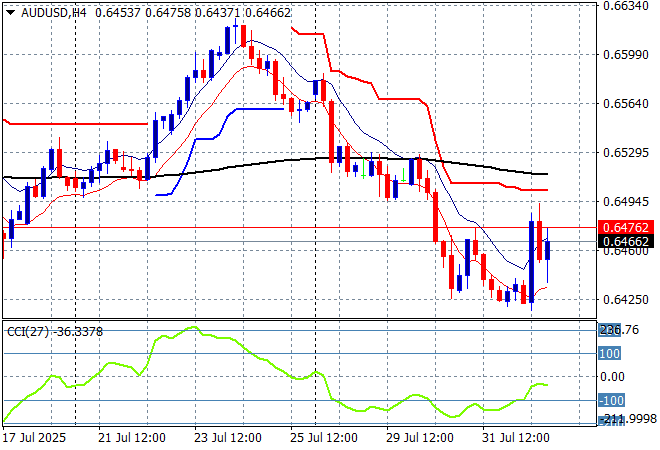
The Australian dollar recently took a big hit on the weaker unemployment print and struggled to not make new weekly lows on more USD strength, but only managed a relatively small lift on Friday night as its likely the RBA cut will cut first before the Fed.
Keep an eye on temporary support at the 63 cent level and also the series of lower highs in recent weeks of signs of less internal support, as this reversal is not that impressive as momentum remains negative in the short term:
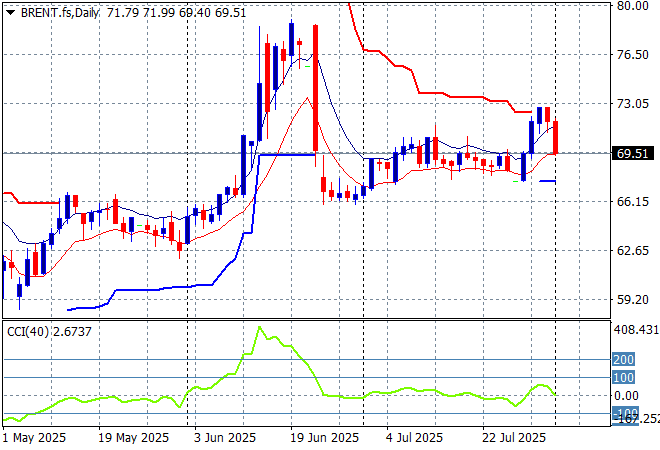
Oil markets were seeing a follow through of the previous session breakouts with Brent crude pushed up towards the $73USD per barrel level but Friday night saw it come off sharply to finish below the $70 level instead.
The daily chart pattern shows the post New Year rally that got a little out of hand and now reverting back to the sideways lower action for the latter half of 2024. The potential for a rally up to the $80 level after making new substantive daily highs was gaining traction but needs more support in the short term:
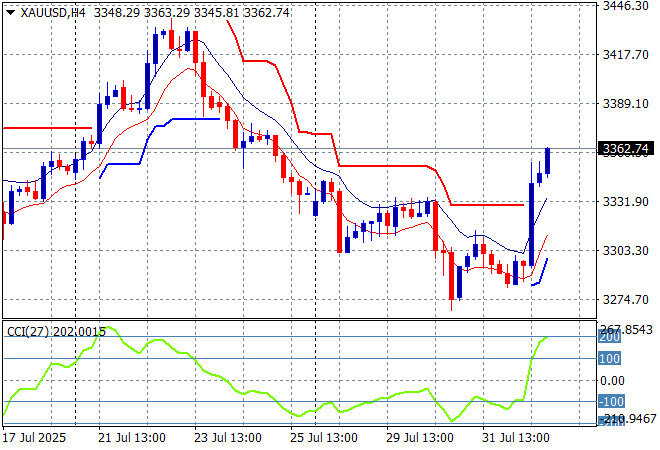
Gold like other undollar’s reversed course on Friday night on the NFP print, soaring back above the $3300USD per ounce level to make a new weekly high after being in decline since mid July.
Short term support had been under threat most of the last three weeks with price almost returning to the late June lows as the USD gained strength. Daily momentum is getting back into the positive zone but only just, as this needs more support going forward:
Glossary of Acronyms and Technical Analysis Terms:
ATR: Average True Range – measures the degree of price volatility averaged over a time period
ATR Support/Resistance: a ratcheting mechanism that follows price below/above a trend, that if breached shows above average volatility
CCI: Commodity Channel Index: a momentum reading that calculates current price away from the statistical mean or “typical” price to indicate overbought (far above the mean) or oversold (far below the mean)
Low/High Moving Average: rolling mean of prices in this case, the low and high for the day/hour which creates a band around the actual price movement
FOMC: Federal Open Market Committee, monthly meeting of Federal Reserve regarding monetary policy (setting interest rates)
DOE: US Department of Energy
Uncle Point: or stop loss point, a level at which you’ve clearly been wrong on your position, so cry uncle and get out/wrong on your position, so cry uncle and get out!