
If you are curious about the differences in methodology between myself and the usual auction data providers, there is an explanation down the page.
This weeks result brought something of a rare result to the Sydney and Melbourne auction markets.
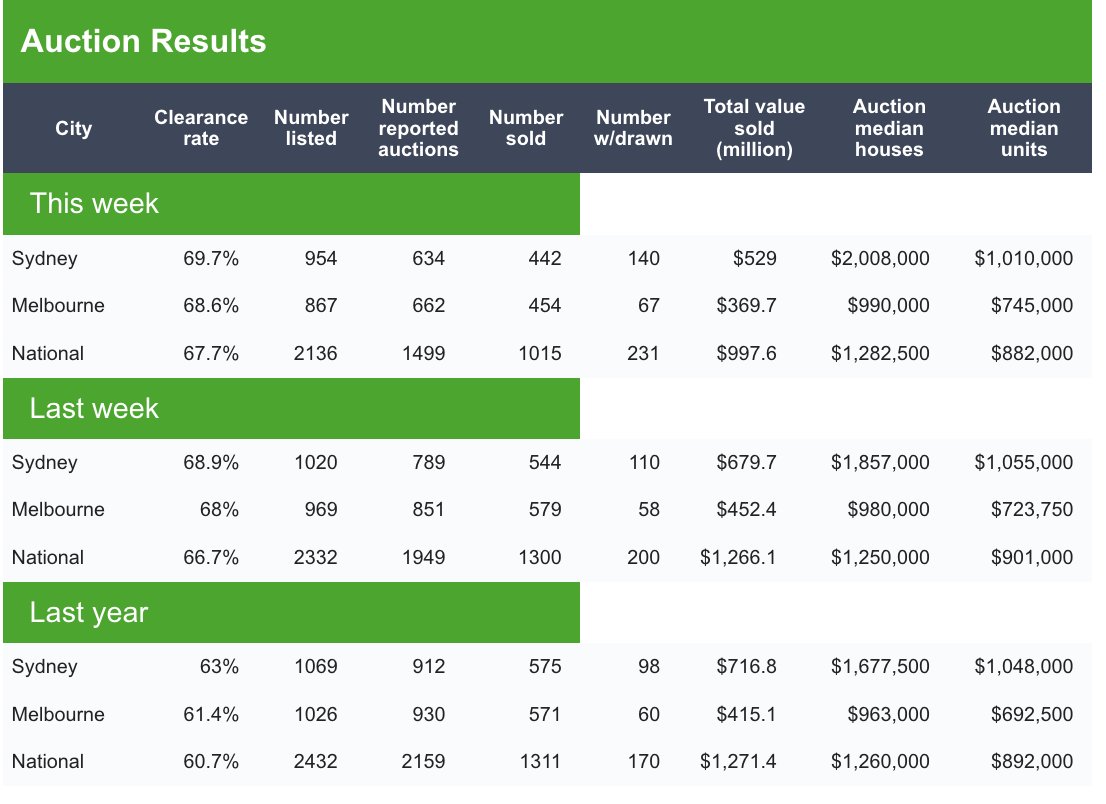
The headline sold to listed clearance rate in Sydney eclipsed that of Melbourne, with Sydney recording 51.6% and Melbourne 50.8%.
The overwhelming majority of the time under normal circumstances (non-public holidays etc) the Melbourne market has higher clearance rates than Sydney, it simply has a higher equilibrium point than the harbourside city.
There were even points during the dark days of the absolute height of lockdown in Melbourne that its results surpassed those of Sydney.
This week also brought another record high for Sydney for this cycle, eclipsing the 50% mark for the first time since June 2023.
Turning our focus to the 4 week moving average, which is used to smooth the innate volatility of auction results, Sydney hit a new cycle high, while Melbourne pulled back slightly from its cycle high last week.
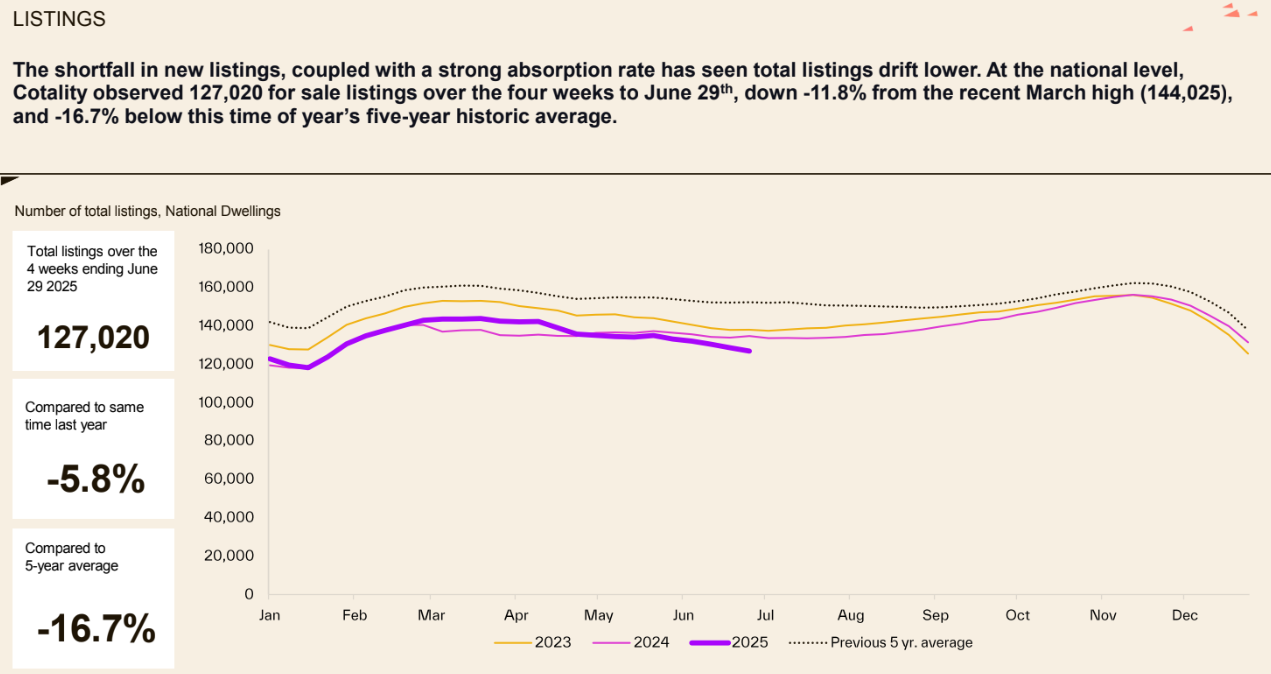
One possibly explanation for the recent strength beyond the obvious shift in monetary policy is the decline in the number of properties listed for sale.
In recent weeks it has begun to dip below levels seen in 2024 and diverged to an even greater degree from the pandemic impacted 5 year average.
Source: Cotality (formerly known as Corelogic)
To what degree the current surge in results will be sustained is unclear, but there is evidence that momentum is building.
Methodology Differences
When Domain, Corelogic or any number of other property data sources produce their preliminary auction results on a Saturday evening, it perhaps isn’t based on what one would think at first glance.
Instead of taking the total number properties sold (by whatever means pre-auction or on the day before 5pm) and then dividing it by the total number of properties up for auction, their approach takes the number reported sold and divides it by the number of properties where the agents or auctioneers have provided a result.
This is illustrated in the graphic below from Domain. In Sydney a few weeks ago, 320 out of 954 (33.5%) auction results were unreported as of the time of the publishing of the preliminary figures. In Melbourne, where the market is performing significantly more strongly than Sydney than the Domain results would suggest 205 out of 867 (23.6%) were missing.
As one might imagine some agents are less than thrilled about reporting their failure to sell a property, so the results simply go missing. On some auction weekends where the market isn’t having a great time, well over 1/3 of results simply don’t get reported.
When the market is extremely hot as it was in 2021, then the unreported rate drops well into single digit percentages.
This issue has been well covered by property sector expert and industry veteran, Louis Christopher, the Managing Director of SQM Research.
It’s worth noting that the gold standard for hard data auction results comes from SQM on the Tuesday following the auction weekend. You can find that here.
