
Wall Street failed to make new highs overnight as risk markets await the looming Fed meeting and Friday’s jobs numbers amid absorbing the latest trade “frameworks of deals that likely won’t be respected” as peripheral nations still wait the 20-25% proposed tariff slog by the Trump regime, including Australia. The USD remains highs against all the majors with Euro beat up again down to the 1.15 handle while the Australian dollar cracked through the 65 cent level.
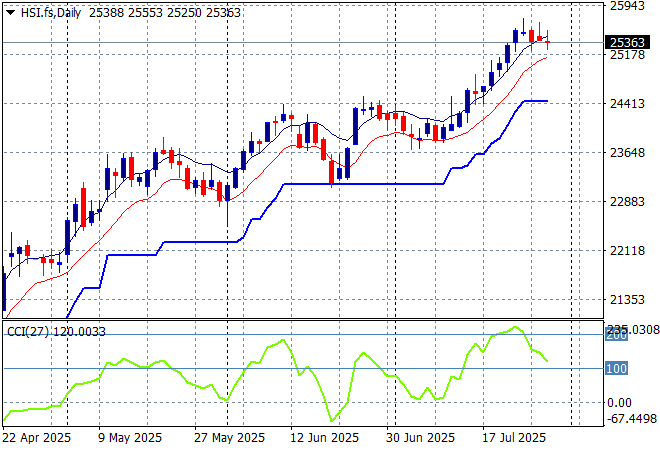
Looking at stock markets from Asia from yesterday’s session, where mainland Chinese share markets are steady going into the close with the Shanghai Composite just below 3600 points while the Hang Seng Index has lost more than 1% but is still just above the 25000 point level.
The daily chart shows a complete fill of the March/April selloff with momentum building again to make new highs. This is still looking like a strong bounceback with firm support at the 23000 point level as a springboard but some resistance is building here:
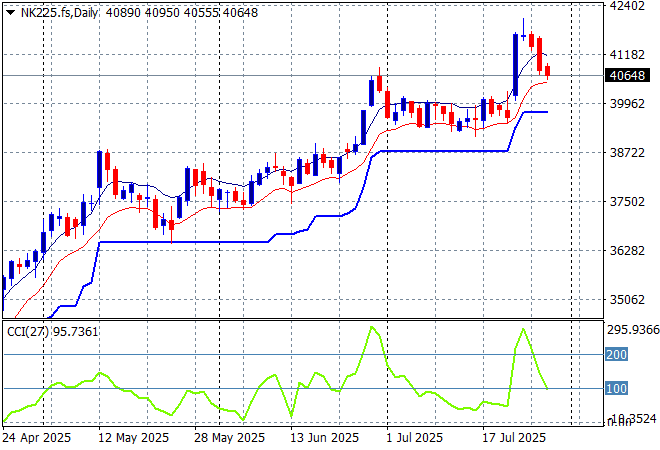
Japanese stock markets remained in the doldrums with the Nikkei 225 pushed nearly 1% lower but still holding on to the 41000 point level.
Daily price action was looking very keen indeed as daily momentum has accelerated after clearing resistance at the 36000 point level with another equity market that looks very stretched and breaking out a bit too strongly here. Watch ATR support continue to ratchet up but also for this rally to potentially have a pullback:
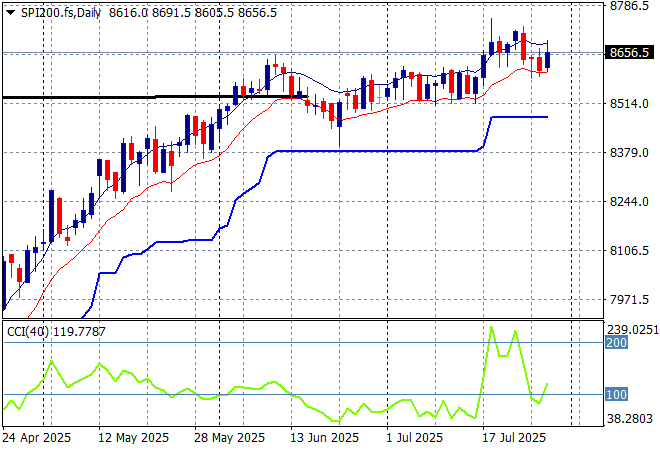
Australian stocks are just treading water in the positive zone with the ASX200 just below the 8700 point level. SPI futures are down nearly 0.2% due to the slip on Wall Street overnight.
The daily chart pattern is still suggesting further upside is still possible with a base being built here and although daily momentum has eased off from its slightly overbought status its still very positive:
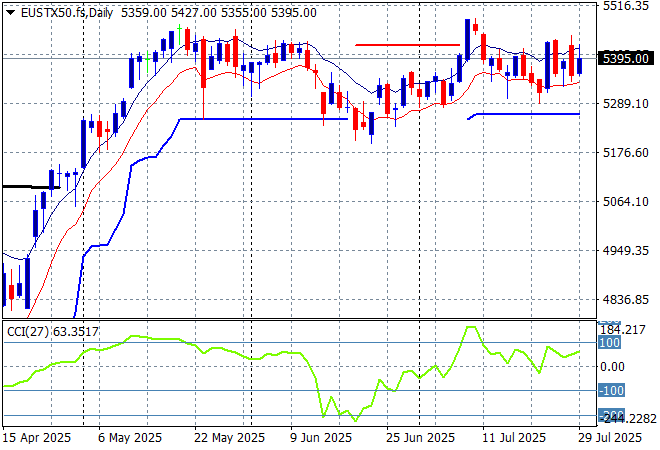
European markets were able to gain traction with most bourses higher across the continent sending the Eurostoxx 50 Index up nearly 0.8% to finish at 5379 points.
Weekly support hasn’t moved in a few months but it was never fully breached, giving time for the market to build a base and breakout here back to the pre “Liberation Day” highs. Watch for further retracement on any Trumpian volatility:
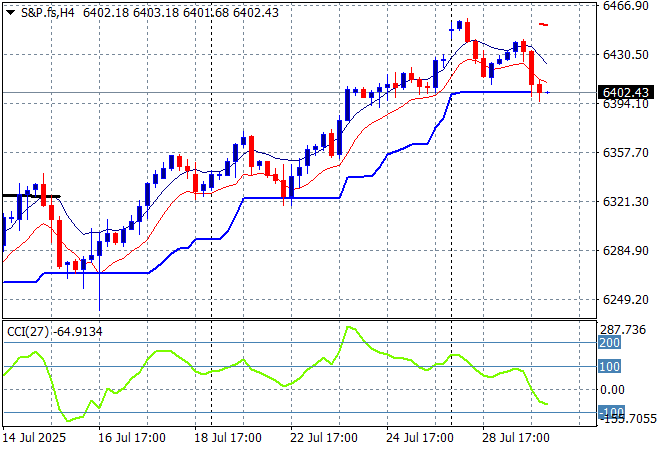
Wall Street tried to push to new record highs but fell back later in the session with the NASDAQ finishing 0.4% lower while the S&P500 lost more than 0.3% to close at 6370 points.
The four hourly chart was looking confused with recent support at the 6200 point level coming under pressure before resistance at the 6350 point level was taken out as more record highs are made. However ATR support is coming under pressure so far this trading week for watch for the small probability of a dip below:
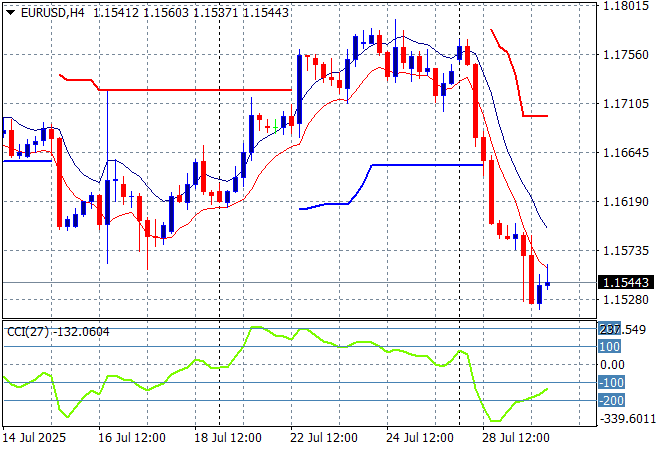
Currency markets are absorbing the latest framework of a trade deal, this time the big one with the EU which immediately sent USD higher against almost everything although this could be short lived as Friday’s jobs print looms. Euro had been well supported as it consolidated just below the 1.18 handle last week in wait but has been sharply sold off down to just below the 1.16 level.
The union currency had been building strength continuously as bad domestic economic news from the US overshadowed any continental slowdown but has reversed that trend in recent weeks. Short term momentum was suggesting a somewhat overbought stage that has now turned into a proper rout with a new weekly low so watch for potentially more damage from here:
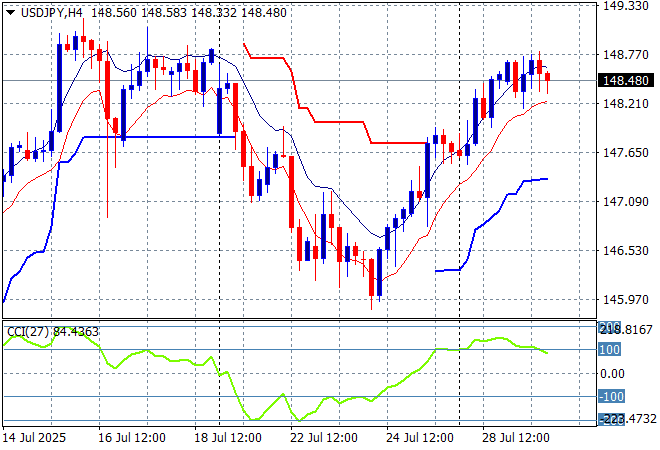
The USDJPY pair faced a proper stall here before the Japanese election then sold off completely to get well below the 146 level but has snapped back on further USD strength almost getting back to its previous weekly high above the 148 level.
I think my contention of a completion of the multi year bearish head and shoulders setup by breaking below the 139 level is off the cards for now, but the inevitable pullback on too much strength and of the course the TACO trade is building risk against the pair:
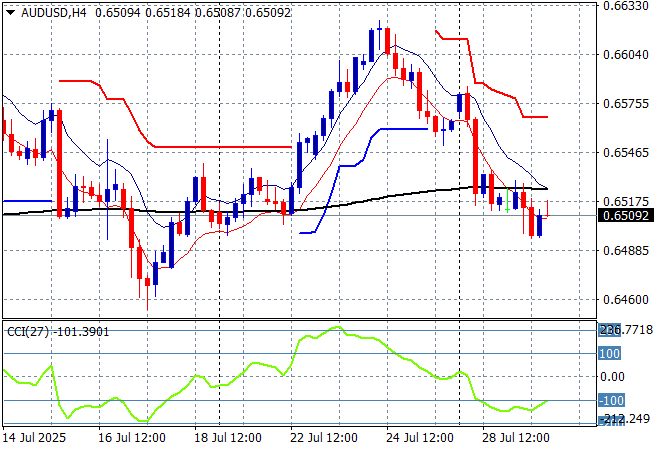
The Australian dollar recently took a big hit on the weaker unemployment print recently and has struggled to not make new weekly lows on more USD strength, breaking below the 65 cent level before coming back slightly.
Keep an eye on temporary support at the 63 cent level and also the series of lower highs in recent weeks of signs of less internal support, but this is not looking better:
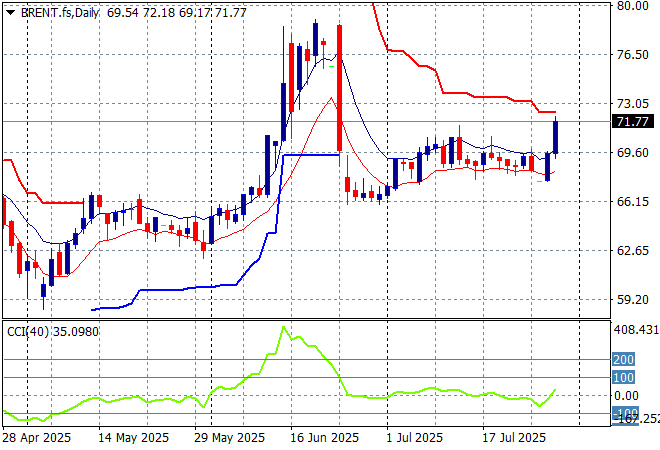
Oil markets have been struggling to make significant gains with the trend still sideways but last night saw some life return with Brent crude finishing just above the $71USD per barrel level yet again.
The daily chart pattern shows the post New Year rally that got a little out of hand and now reverting back to the sideways lower action for the latter half of 2024. The potential for a return to the previous lows is still there if it cannot make a substantive new daily high so this might give it some positive momentum:
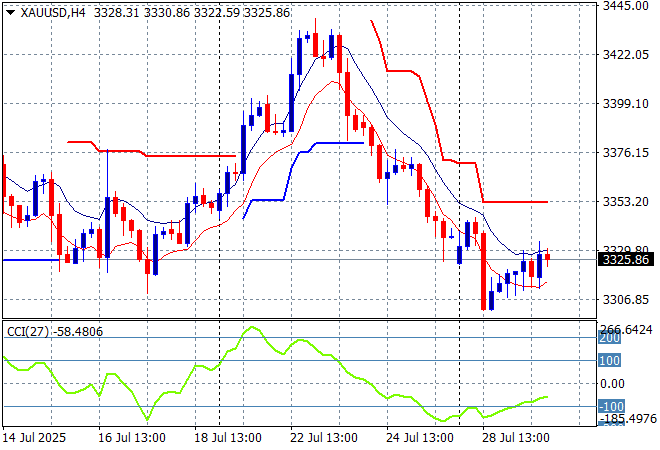
Gold made a false break above the $3400 level recently but plummeted in subsequent sessions, finishing below the $3340 level on Friday night and then again testing the $3300 level. Last night saw it bounced back mildly to finish at $3325USD per ounce.
Short term support has been under threat most of the last three weeks with price almost returning to the late June lows as the USD gains strength. Daily momentum is quite negative now with short term momentum very oversold:
Glossary of Acronyms and Technical Analysis Terms:
ATR: Average True Range – measures the degree of price volatility averaged over a time period
ATR Support/Resistance: a ratcheting mechanism that follows price below/above a trend, that if breached shows above average volatility
CCI: Commodity Channel Index: a momentum reading that calculates current price away from the statistical mean or “typical” price to indicate overbought (far above the mean) or oversold (far below the mean)
Low/High Moving Average: rolling mean of prices in this case, the low and high for the day/hour which creates a band around the actual price movement
FOMC: Federal Open Market Committee, monthly meeting of Federal Reserve regarding monetary policy (setting interest rates)
DOE: US Department of Energy
Uncle Point: or stop loss point, a level at which you’ve clearly been wrong on your position, so cry uncle and get out/wrong on your position, so cry uncle and get out!