
Despite a dreadful durable goods order print on Friday night, Wall Street still pushed to new record highs as earnings are coming in solid as expected, helped by buybacks and the “Big Beautiful Bill” spending. Other risk markets were not so easily convinced with European shares falling back while the USD climbed to a two week high against most of the majors on the back of supposedly more trade US “deals” although the chances of a European missive before August 1st is looking slim. The Australian dollar wasn’t able to hold above its recent a new monthly high above the 66 cent level and has finished the week at the mid 65 cent level. The economic calendar is packed this trading week with a big US focus, particularly earnings on Wall Street and the advanced GDP print.
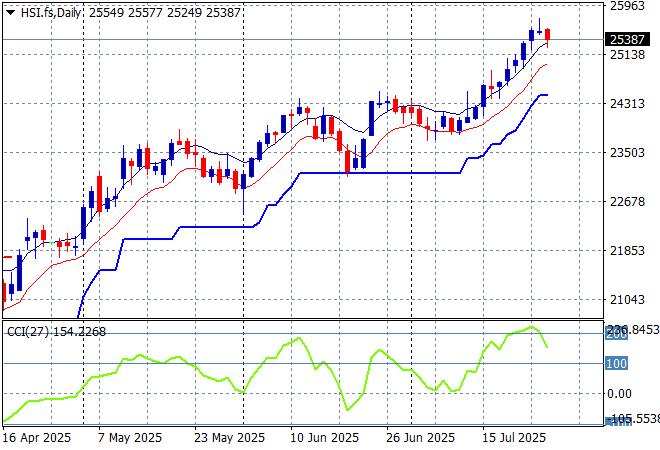
Looking at stock markets from Asia from Friday’s session, where mainland Chinese share markets sold off from the open with the Shanghai Composite down 0.3% to finish below the 3600 points while the Hang Seng Index was off by more than 1% but is staying just above the 25000 point level.
The daily chart shows a complete fill of the March/April selloff with momentum building again to make new highs. This is still looking like a strong bounceback with firm support at the 23000 point level as a springboard:
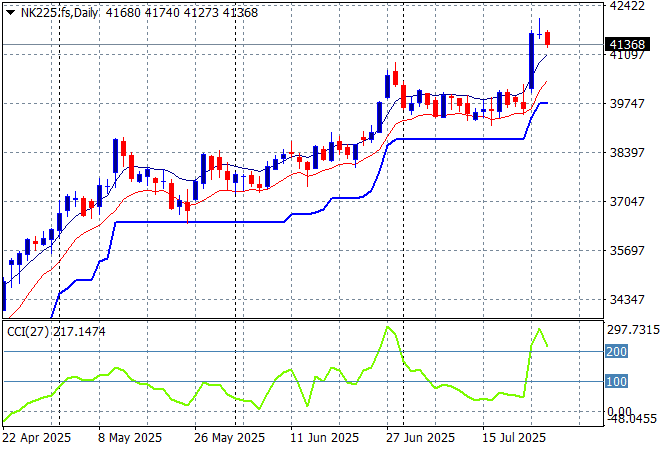
Japanese stock markets were also in retreat with the Nikkei 225 pushed nearly 0.9% lower at 41456 points.
Daily price action was looking very keen indeed as daily momentum has accelerated after clearing resistance at the 36000 point level with another equity market that looks very stretched and breaking out a bit too strongly here. Watch ATR support continue to ratchet up but also for this rally to potentially have a pullback:
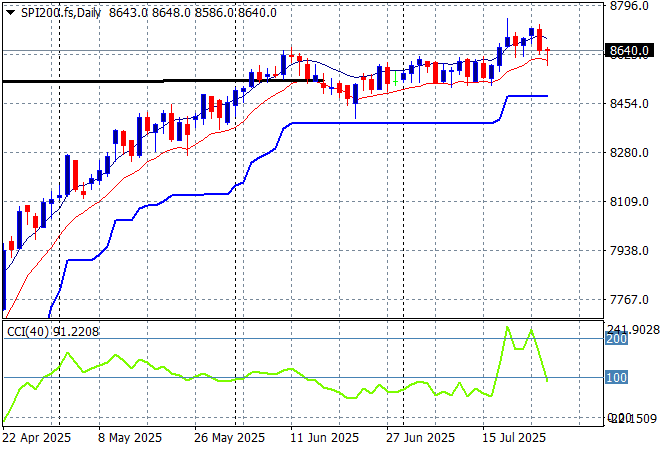
Australian stocks are losing ground again with the ASX200 about to close 0.5% lower at 8667 points. SPI futures are down slightly despite the solid finish from Wall Street on Friday night.
The daily chart pattern is still suggesting further upside is still possible with a base being built here and although daily momentum has eased off from its slightly overbought status its still very positive:
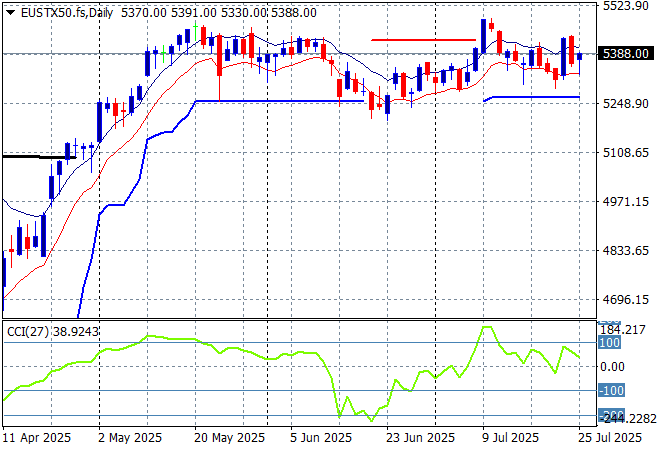
European markets were treading water again following the ECB non decision with some losses across the continent sending the Eurostoxx 50 Index down nearly 0.2% to finish at 5352 points.
Weekly support hasn’t moved in a few months but it was never fully breached, giving time for the market to build a base and breakout here back to the pre “Liberation Day” highs. Watch for further retracement on any Trumpian volatility:
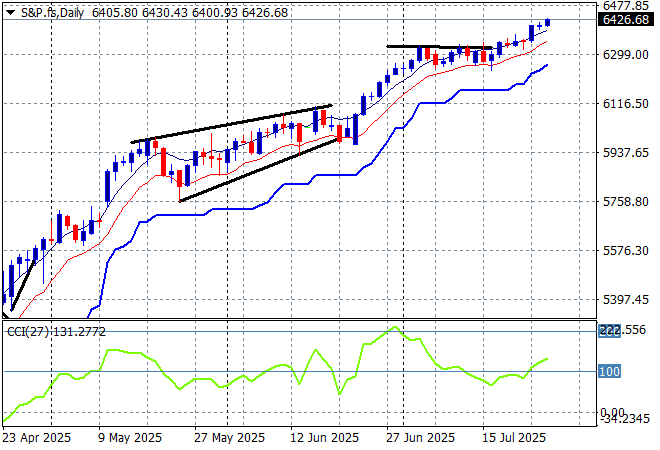
Wall Street again pushed to new record highs with modest gains with the NASDAQ finishing 0.2% higher while the S&P500 eventually closed 0.4% higher to 6388 points in a better session.
The four hourly chart was looking confused with recent support at the 6200 point level coming under pressure before resistance at the 6350 point level was taken out as more record highs are made as ATR support climbs and everything is awesome:
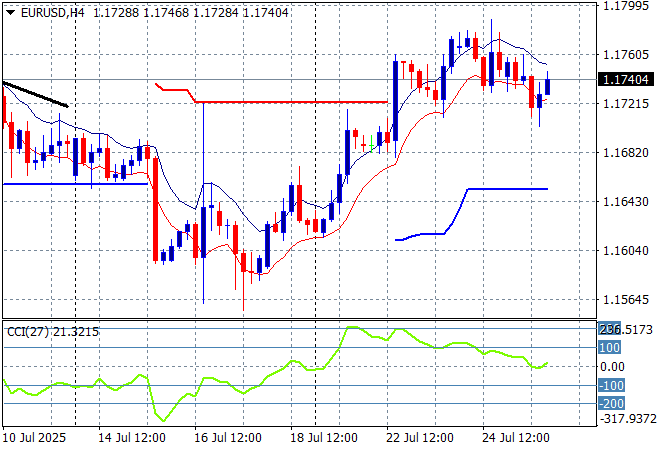
Currency markets were still focused on trade deals with the USD having a mixed session against the majors again, with the Canadian Loonie and Pound Sterling sliding back but Euro remaining well supported as it consolidates just below the 1.18 handle as we all await a looming European/US trade deal.
The union currency had been building strength continuously as bad domestic economic news from the US overshadowed any continental slowdown but has reversed that trend in recent weeks. Short term momentum was suggesting a proper reversal with support at the 1.1650 mid level taken out but this is looking very lively and somewhat overbought:
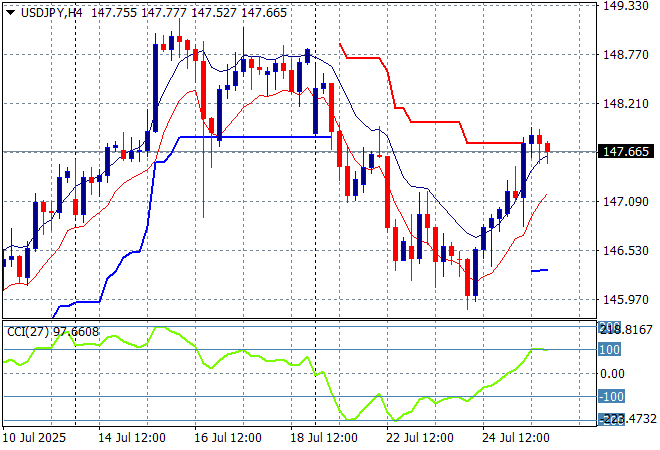
The USDJPY pair faced a proper stall here before the Japanese election then sold off completely to get well below the 146 level but has snapped back somewhat in the previous session on temporary USD strength as traders mull the details of the new trade deal.
I think my contention of a completion of the multi year bearish head and shoulders setup by breaking below the 139 level is off the cards for now, but the inevitable pullback on too much strength and of the course the TACO trade is building risk against the pair:
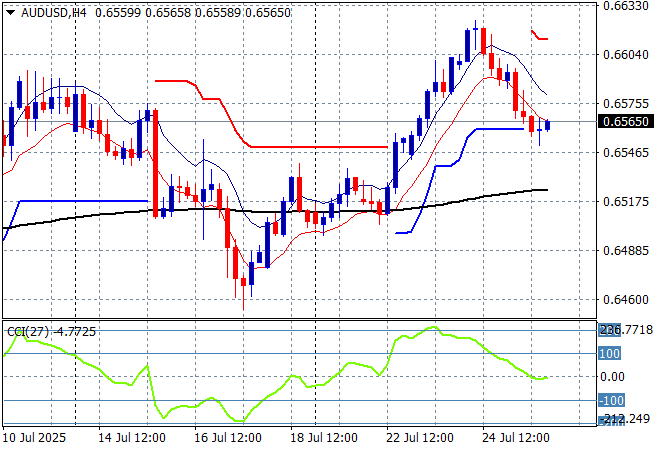
The Australian dollar recently took a big hit on the weaker unemployment print, although it managed to claw back most of that later last week it was still stuck around the 65 handle again as too many domestic and USD factors keep the Pacific Peso on a downtrend. After making a new monthly high to get back above the 66 cent level it has come back to the just above the mid 65 cent level on USD strength.
Keep an eye on temporary support at the 63 cent level and also the series of lower highs in recent weeks of signs of less internal support, but this is looking better:
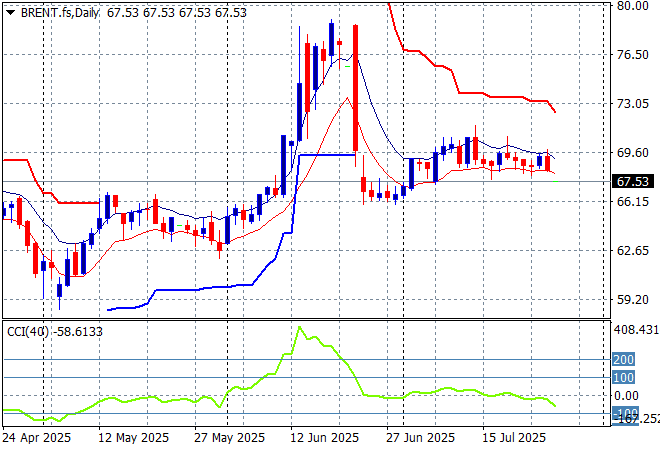
Oil markets were able to put in a small bounce on the unexpected spike of OPEC+ production a week or so ago but are still struggling to make significant gains with the trend starting to weaken as Brent crude finished below the $69USD per barrel level yet again.
The daily chart pattern shows the post New Year rally that got a little out of hand and now reverting back to the sideways lower action for the latter half of 2024. The potential for a return to the previous lows is still there if it cannot make a substantive new daily high.
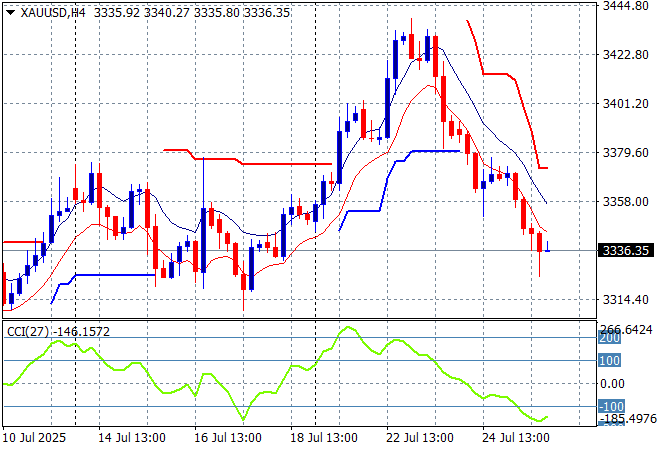
Gold made a surge play at the start of the week, flying right up through the $3400USD per ounce level, but this was a false break as it plummeted in subsequent sessions, finishing below the $3340 level on Friday night.
Short term support has been under threat most of the last three weeks with price almost returning to the late June lows as the USD gains strength. Daily momentum is very positive now with short term momentum perhaps somewhat overbought but looking good for further gains:
Glossary of Acronyms and Technical Analysis Terms:
ATR: Average True Range – measures the degree of price volatility averaged over a time period
ATR Support/Resistance: a ratcheting mechanism that follows price below/above a trend, that if breached shows above average volatility
CCI: Commodity Channel Index: a momentum reading that calculates current price away from the statistical mean or “typical” price to indicate overbought (far above the mean) or oversold (far below the mean)
Low/High Moving Average: rolling mean of prices in this case, the low and high for the day/hour which creates a band around the actual price movement
FOMC: Federal Open Market Committee, monthly meeting of Federal Reserve regarding monetary policy (setting interest rates)
DOE: US Department of Energy
Uncle Point: or stop loss point, a level at which you’ve clearly been wrong on your position, so cry uncle and get out/wrong on your position, so cry uncle and get out!