
Everything is awesome for stock markets as Wall Street pushed through more record highs as earnings surprised to the upside for everyone, except Tesla! The Japan-US trade deal buoyed spirits even if the details actually outweigh the headline 15% tariff rate, but its making the Trumpists happy as they pivot towards similar bullying against the EU to make sure that Americans pay more for foreign imported goods (aka almost all goods sold). The USD continued it steep falls against all the major currency pairs again with even the beleagured Australian dollar pushed to a new monthly high above the 66 cent level.
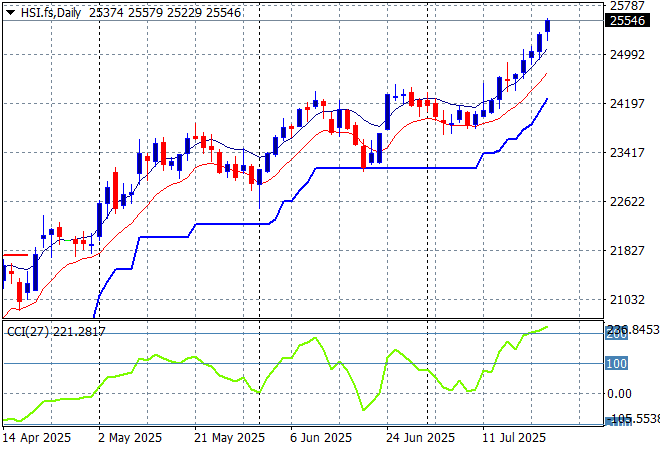
Looking at stock markets from Asia from yesterday’s session, where mainland Chinese share markets were lifting again with the Shanghai Composite getting above the 3600 point level before stumbling a little going into the close while the Hang Seng was able to extend its gains above the 25000 point level in another strong session.
The daily chart shows a complete fill of the March/April selloff with momentum building again to make new highs. This is still looking like a strong bounceback with firm support at the 23000 point level as a springboard:
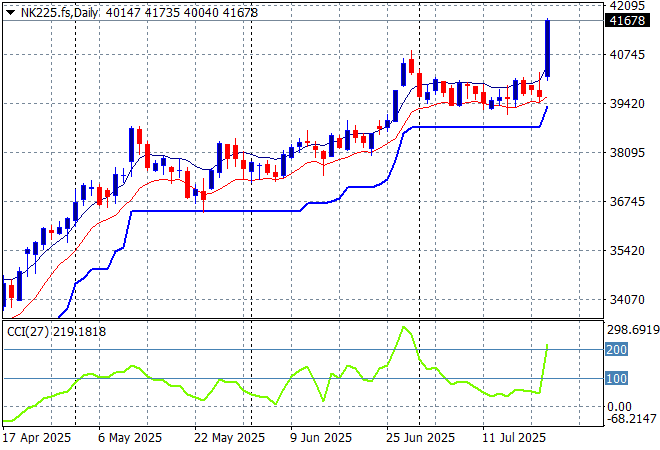
Japanese stock markets were loving the trade “deal” with the Nikkei 225 pushing more than 3% higher to 41216 points.
Daily price action was looking very keen indeed as daily momentum has accelerated after clearing resistance at the 36000 point level with another equity market that looks very stretched and breaking out a bit too strongly here. Watch ATR support continue to ratchet up but also for this rally to potentially have a pullback:
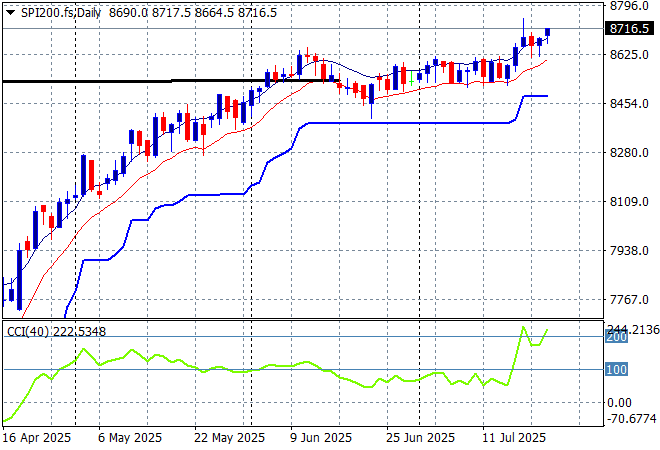
Australian stocks were able to join in with the ASX200 up 0.7% to 8745 points. SPI futures are up slightly given the gains on Wall Street overnight.
The daily chart pattern is still suggesting further upside is still possible with a base being built here and although daily momentum has eased off from its slightly overbought status its still very positive:
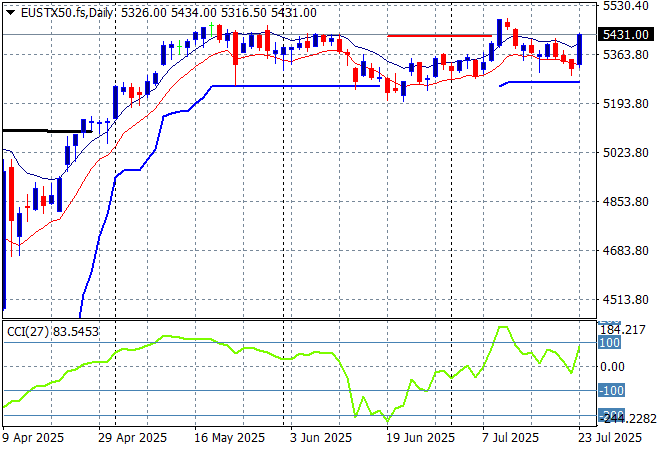
European markets finally got out of their unsettled mood with positive movement on the continent with the Eurostoxx 50 Index closing nearly 1% higher at 5344 points.
Weekly support hasn’t moved in a few months but it was never fully breached, giving time for the market to build a base and breakout here back to the pre “Liberation Day” highs. This looks like a strong, if somewhat overdone breakout with some positive momentum to the upside but watch for further retracement on any Trumpian volatility:
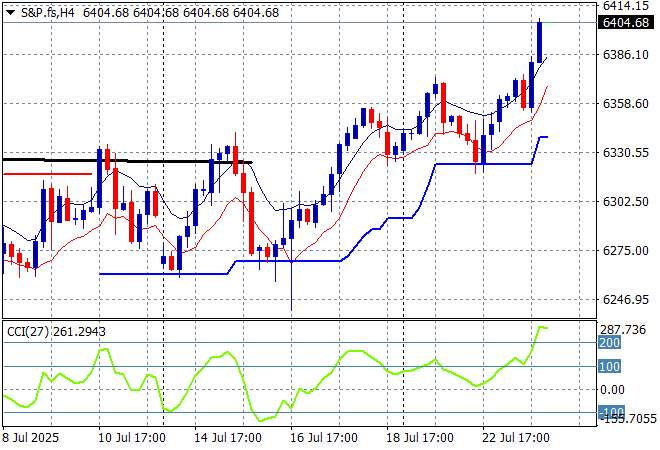
Wall Street pushed to new record highs across the board in reaction to the Japanese trade deal with the NASDAQ finishing 0.6% higher while the S&P500 eventually closed some 0.81% higher at 6358 points in a much more convincing session.
The four hourly chart was looking confused with recent support at the 6200 point level coming under pressure before resistance at the 6350 point level was taken out as it looks like more record highs are forthcoming, as ATR support climbs and everything is awesome:
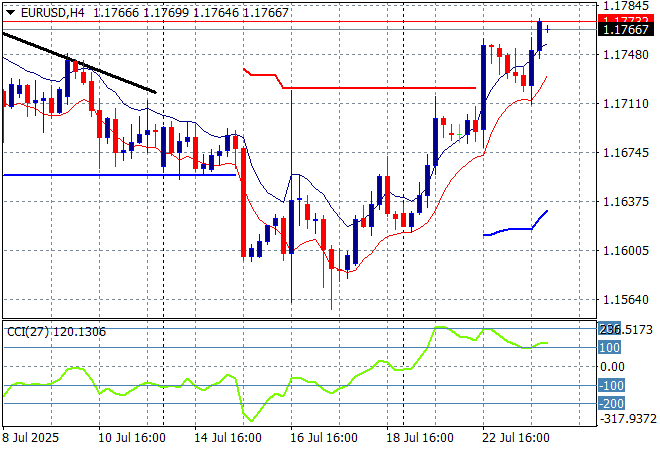
Currency markets were squarely focused on trade with the USD losing out against most of the majors again, particularly the Canadian Loonie and Pound Sterling but Euro also was on a tear, almost hitting the 1.18 handle as speculation that a EU/USA deal might be next.
The union currency had been building strength continuously as bad domestic economic news from the US overshadowed any continental slowdown but has reversed that trend in recent weeks. Short term momentum was suggesting a proper reversal with support at the 1.1650 mid level taken out but this is looking very lively and somewhat overbought:
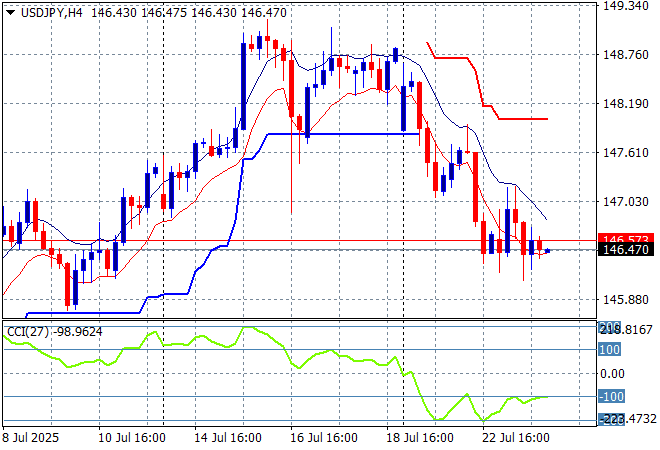
The USDJPY pair faced a proper stall here before the Japanese election and has now sold off completely to remain well below the 147 level and hasn’t moved despite the trade deal “news”..
I think my contention of a completion of the multi year bearish head and shoulders setup by breaking below the 139 level is off the cards for now, but the inevitable pullback on too much strength and of the course the TACO trade is building risk against the pair:
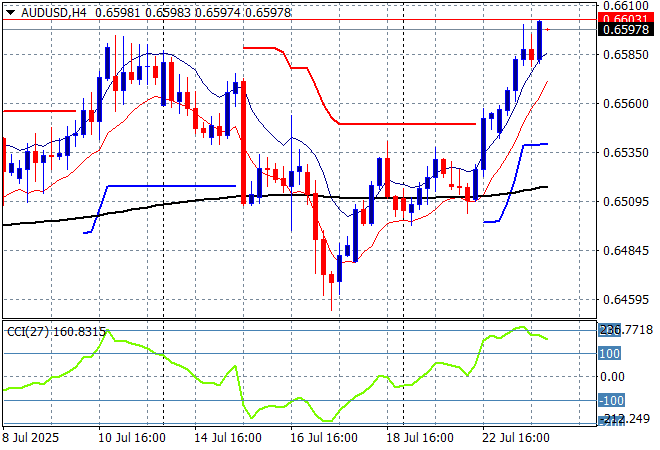
The Australian dollar recently took a big hit on the weaker unemployment print, although it managed to claw back most of that later last week it was still stuck around the 65 handle again as too many domestic and USD factors keep the Pacific Peso on a downtrend. However its now moved to more strength on USD weakness making a new monthly high to get back above the 66 cent level overnight.
Keep an eye on temporary support at the 63 cent level and also the series of lower highs in recent weeks of signs of less internal support, but this is looking better:
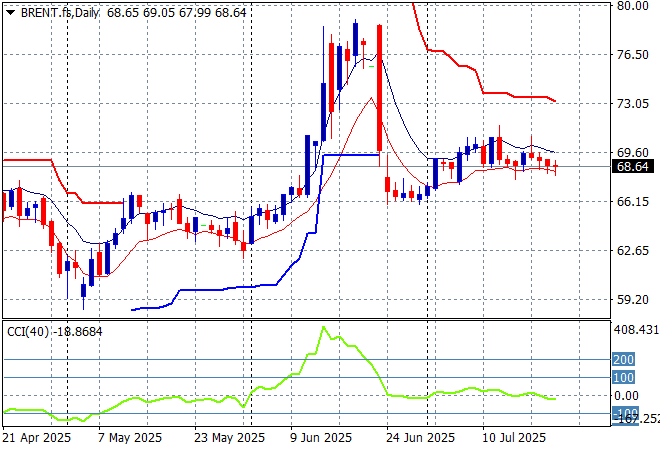
Oil markets were able to put in a small bounce on the unexpected spike of OPEC+ production a week or so ago but are still struggling to make significant gains with the trend starting to weaken as Brent crude stays below the $69USD per barrel level yet again overnight.
The daily chart pattern shows the post New Year rally that got a little out of hand and now reverting back to the sideways lower action for the latter half of 2024. The potential for a return to the previous lows is still there if it cannot make a substantive new daily high.
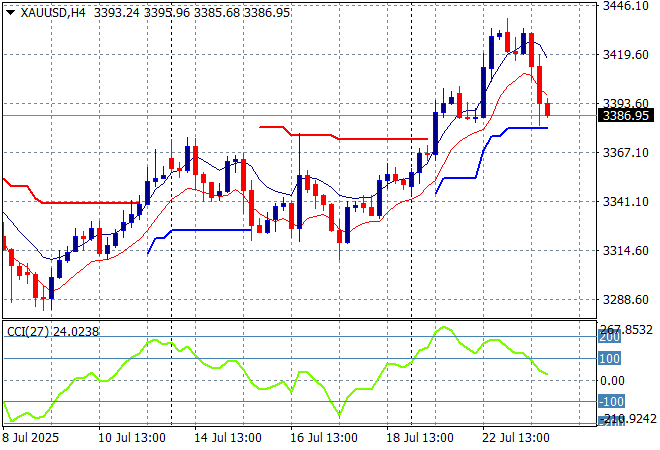
Gold was struggling after managing to get out of its recent hole to bounce back above the $3300USD per ounce level last week but made a surge play in the previous session, flying right up through the $3400USD per ounce level, but it took back most of those gains overnight.
Short term support has been under threat most of the last three weeks with price almost returning to the late June lows as the USD gains strength. Daily momentum is very positive now with short term momentum perhaps somewhat overbought but looking good for further gains:
Glossary of Acronyms and Technical Analysis Terms:
ATR: Average True Range – measures the degree of price volatility averaged over a time period
ATR Support/Resistance: a ratcheting mechanism that follows price below/above a trend, that if breached shows above average volatility
CCI: Commodity Channel Index: a momentum reading that calculates current price away from the statistical mean or “typical” price to indicate overbought (far above the mean) or oversold (far below the mean)
Low/High Moving Average: rolling mean of prices in this case, the low and high for the day/hour which creates a band around the actual price movement
FOMC: Federal Open Market Committee, monthly meeting of Federal Reserve regarding monetary policy (setting interest rates)
DOE: US Department of Energy
Uncle Point: or stop loss point, a level at which you’ve clearly been wrong on your position, so cry uncle and get out/wrong on your position, so cry uncle and get out!