
All eyes were on the release of the latest US CPI print which accelerated over the year showing that the Trump regime’s tariff crusade is beginning to have an effect on domestic inflation. This is just the start as the full effect has not been seen yet, with the core goods CPI print had its largest gain in 2 years, even before the August 1 deadline kicks in. European shares were off again as the EU continues to mull retaliation against the tariffs while the USD soared to new highs as undollars weakened across the board on the clear signal that the Fed has an inflation battle on its hands.
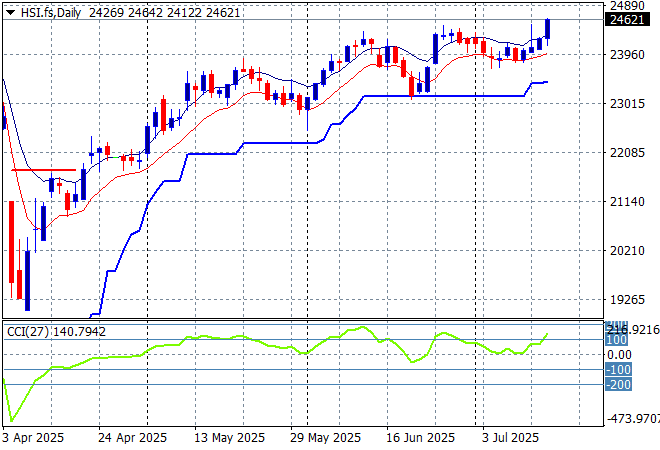
Looking at stock markets from Asia from yesterday’s session, where mainland Chinese share markets dropped on the mixed economic data with the Shanghai Composite down nearly 1% at one stage before closing 0.4% lower while the Hang Seng went the other way, launching 1.6% higher to extend well above the 24000 point level.
The daily chart shows a near complete fill of the March/April selloff although momentum has now reversed after being slightly overbought as price action meets trailing support at the 23000 point level. This was looking like a strong bounceback with firm support at the 23000 point level as a springboard:
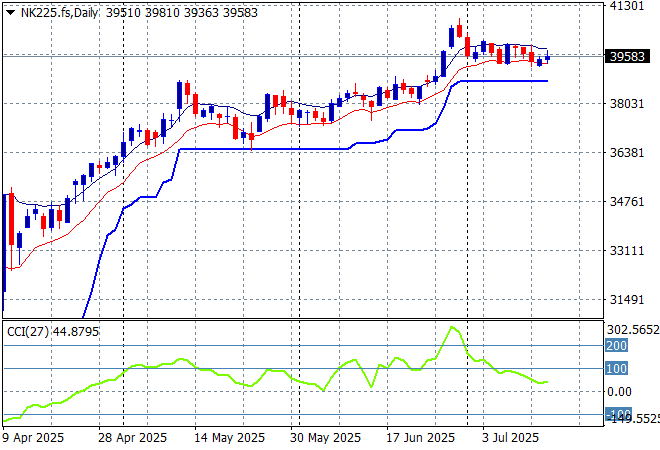
Meanwhile Japanese stock markets didn’t move around much to start with as all eyes were on the bond market instead until later in the session when the Nikkei 225 lifted 0.5% but still remains below the 40000 point barrier.
Daily price action was looking very keen indeed as daily momentum has accelerated after clearing resistance at the 36000 point level with another equity market that looks very stretched and breaking out a bit too strongly here. Watch ATR support continue to ratchet up but also for this rally to have a pullback:
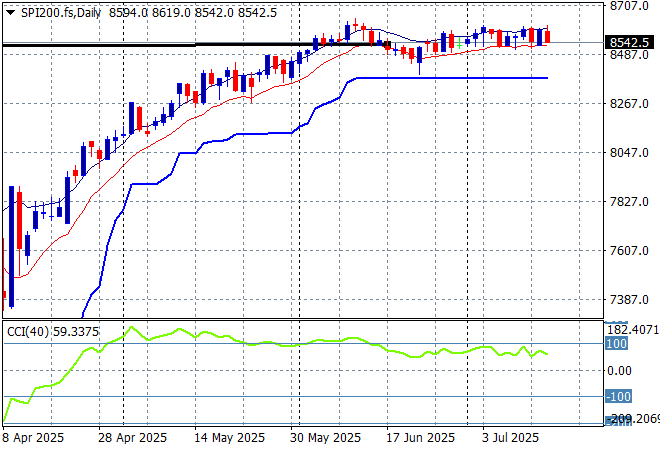
Australian stocks were the best in the region with the ASX200 up 0.7% to breach the 8600 point level, closing at 8630 points. SPI futures however are down nearly 0.7% due to the unease on European markets and Wall Street overnight.
The daily chart pattern is still suggesting further upside is still possible with a base being built here and although daily momentum has eased off from its slightly overbought status its still very positive:
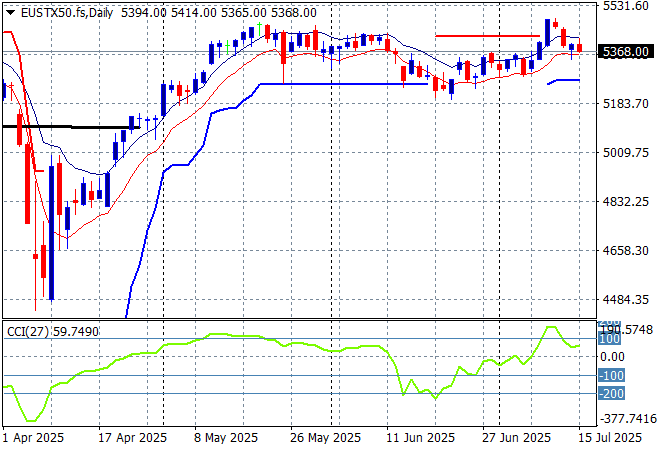
European markets fell back again as the US tariff weighs on risk with the Eurostoxx 50 Index closing 0.3% lower at 5354 points.
Weekly support hasn’t moved in a few months but it was never fully breached, giving time for the market to build a base and breakout here back to the pre “Liberation Day” highs. This looks like a strong, if somewhat overdone breakout with some positive momentum to the upside but watch for further retracement on any Trumpian volatility:
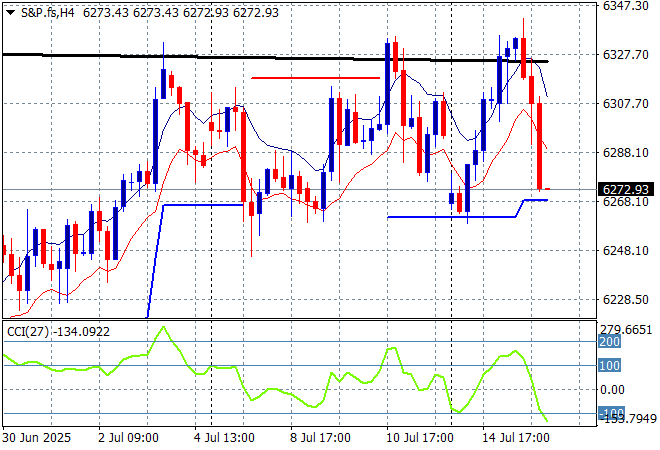
Wall Street did not really like the CPI print overnight with the headline Dow off by 1% while the NASDAQ lifted only due to Nvidia as the S&P500 lost some 0.4% to finish at 6243 points.
The four hourly chart looks confused again with recent support at the 6200 point level about to come under pressure while resistance at the 6350 point level not yet breached as bids to extend these record highs are not yet forthcoming:
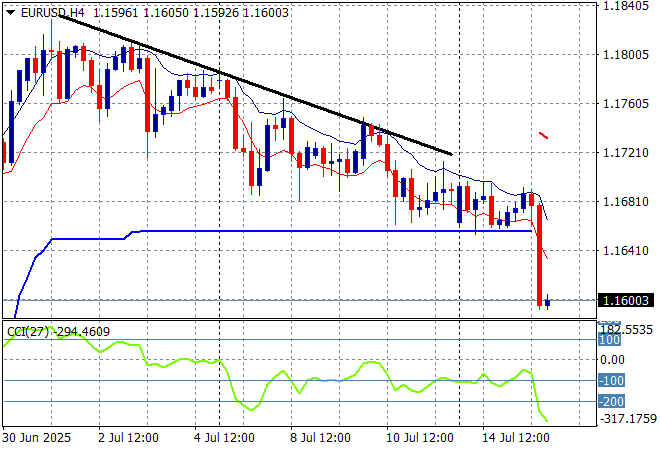
Currency markets have finally got the June US CPI print and reacted in kind, predicting the trajectory for the Fed for the second half of the year as it will most likely have a stagflation battle on its hands. Euro was cut down sharply on the USD bid with a solid move down to the 1.16 handle taking out recent support.
The union currency has been building strength continuously as bad domestic economic news from the US overshadowed any continental slowdown but has reversed that trend. Short term momentum was suggesting a proper reversal with support at the 1.1650 mid level taken out but is considerably oversold:
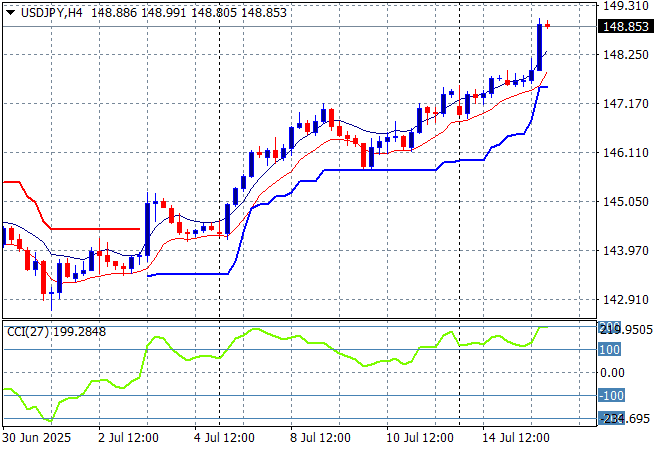
The USDJPY pair of course launched to the moon, breaking through the 148 handle on the US CPI print, taking out new monthly highs.
I think my contention of a completion of the multi year bearish head and shoulders setup by breaking below the 139 level is off the cards for now, but watch for the inevitable pullback on too much strength here and of the course the TACO trade:
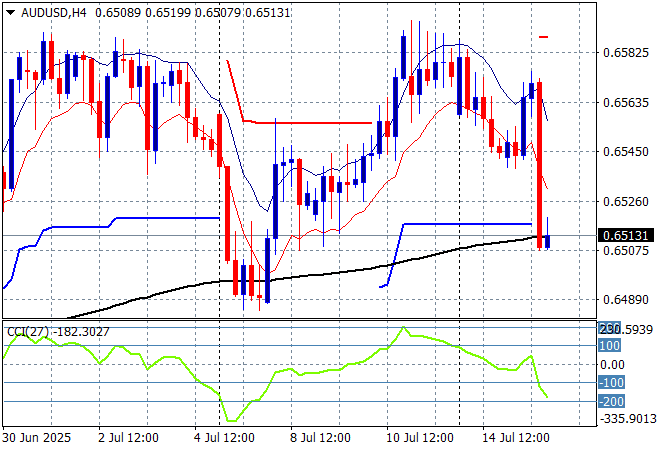
The Australian dollar had been relatively weak going into the RBA meeting last week after looking like holding on to the 65 handle but has been finding resistance at the 66 cent level too hard to overcome as it broke down on the US CPI print.
Stepping back for a longer point of view (and looking at the trusty AUDNZD weekly cross) price action has remained supported by the 200 day MA (moving black line) after bouncing off a near new five year low. Keep an eye on temporary support at the 63 cent level and also the series of lower highs in recent weeks of signs of less internal support:
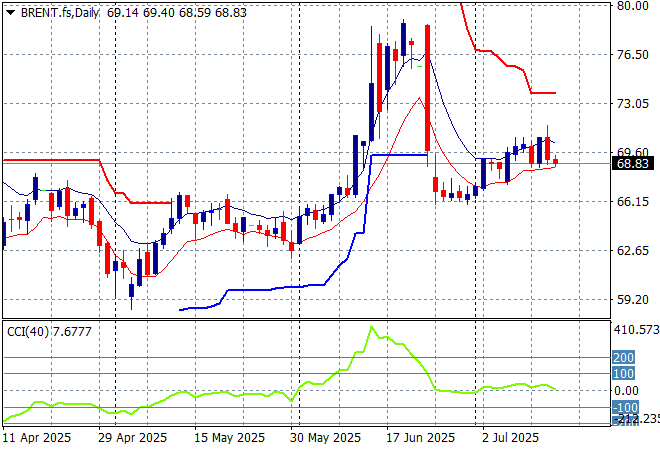
Oil markets were putting in a small bounce on the unexpected spike of OPEC+ production but are still struggling to make significant gains with the trend only slightly up as Brent crude retraced below the $69USD per barrel level overnight.
The daily chart pattern shows the post New Year rally that got a little out of hand and now reverting back to the sideways lower action for the latter half of 2024. The potential for a return to the previous lows is still there if it cannot make a substantive new daily high.
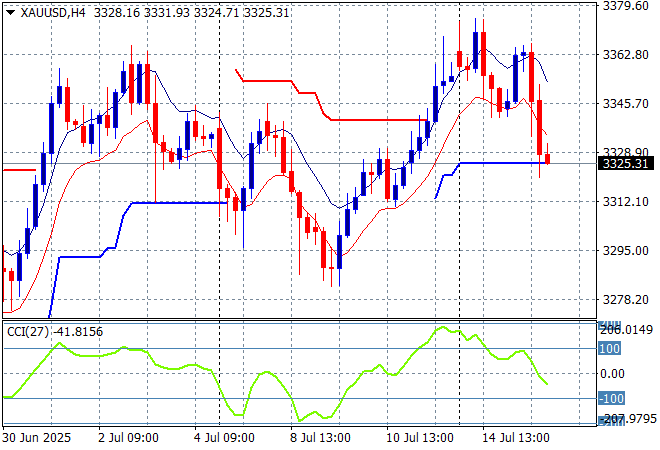
Gold was struggling again after managing to get out of its recent hole to bounce back above the $3300USD per ounce level but rolled over alongside other undollars on the inflation print, giving up most of those gains.
Short term support has been under threat most of the last three weeks with price almost returning to the late June lows as the USD gains strength. Momentum is retracing back from its slightly overbought position to a negative setting so watch for a full rollover below ATR support next:
Glossary of Acronyms and Technical Analysis Terms:
ATR: Average True Range – measures the degree of price volatility averaged over a time period
ATR Support/Resistance: a ratcheting mechanism that follows price below/above a trend, that if breached shows above average volatility
CCI: Commodity Channel Index: a momentum reading that calculates current price away from the statistical mean or “typical” price to indicate overbought (far above the mean) or oversold (far below the mean)
Low/High Moving Average: rolling mean of prices in this case, the low and high for the day/hour which creates a band around the actual price movement
FOMC: Federal Open Market Committee, monthly meeting of Federal Reserve regarding monetary policy (setting interest rates)
DOE: US Department of Energy
Uncle Point: or stop loss point, a level at which you’ve clearly been wrong on your position, so cry uncle and get out/wrong on your position, so cry uncle and get out!