
While the NASDAQ just eked out another record high it was all eyes on the USD as markets prepare for the release tonight of the latest US CPI print where we should see if the Trump regime’s tariff crusade has had an effect on domestic inflation. European shares were off slightly as the EU mulls retaliation against the flailing US Empire while at the same time making free trade deals with other nations. The undollars are still weakening however with Euro and Pound Sterling pulling back further while the Australian dollar has finally rolled over after hitting significant resistance at the 66 cent level.
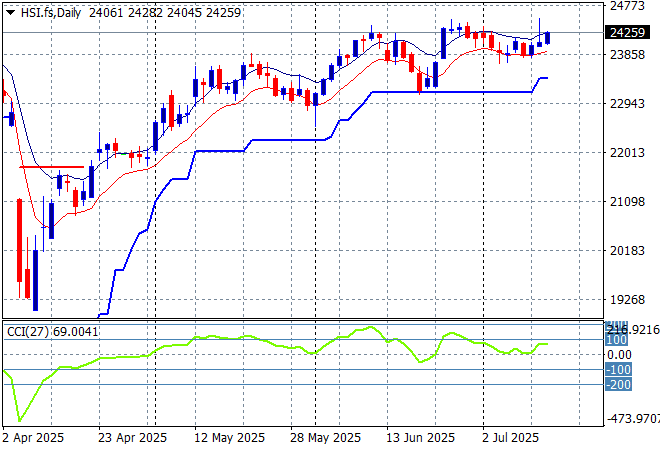
Looking at stock markets from Asia from yesterday’s session, where mainland Chinese share markets were up only slightly with Shanghai Composite closing just above the 3500 point level while the Hang Seng also closed just 0.4% higher to get back above the 24000 point level.
The daily chart shows a near complete fill of the March/April selloff although momentum has now reversed after being slightly overbought as price action meets trailing support at the 23000 point level. This was looking like a strong bounceback with firm support at the 23000 point level as a springboard but resistance is building into a rollover here:
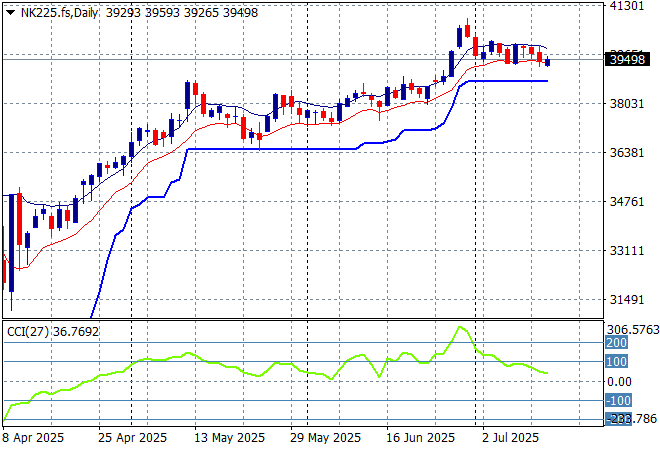
Japanese stock markets were doing the same with Nikkei 225 down 0.3% to remain just below the 40000 point barrier.
Daily price action was looking very keen indeed as daily momentum has accelerated after clearing resistance at the 36000 point level with another equity market that looks very stretched and breaking out a bit too strongly here. Watch ATR support continue to ratchet up but also for this rally to have a pullback:
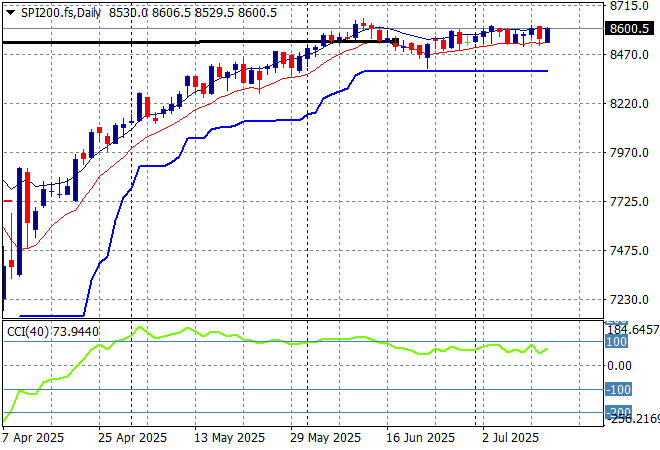
Australian stocks were also dead flat with the ASX200 stuck at just below the 8600 point level. SPI futures are actually up strongly despite the minor lifts on Wall Street overnight.
The daily chart pattern is still suggesting further upside is still possible with a base being built here and although daily momentum has eased off from its slightly overbought status its still very positive:
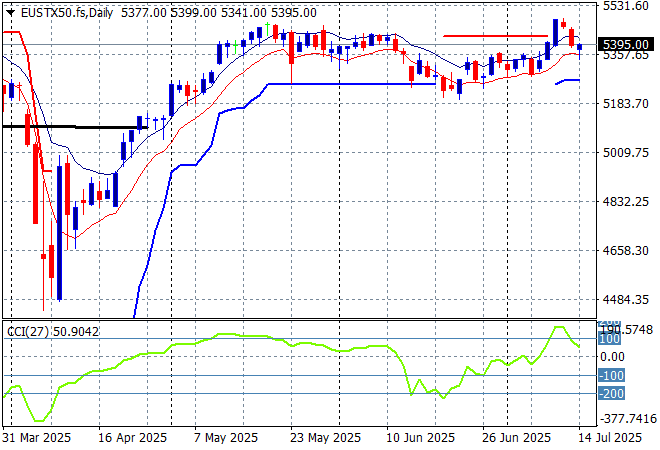
European markets fell back slightly again after the weekend gap with the Eurostoxx 50 Index closing 0.3% lower at 5370 points.
Weekly support hasn’t moved in a few months but it was never fully breached, giving time for the market to build a base and breakout here back to the pre “Liberation Day” highs. This looks like a strong, if somewhat overdone breakout with some positive momentum to the upside but watch for further retracement on any Trumpian volatility:
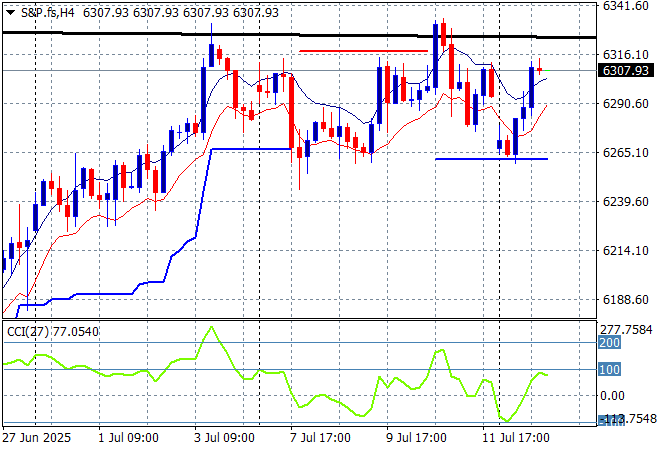
Wall Street had small lifts overnight after backing off from recent new record highs on Friday night with the NASDAQ and the S&P500 both putting on around 0.3% or so with the latter finishing at 6268 points.
A big beautiful bounceback was seeing the 6000 point level brushed aside as everyone bought everything as the asset owners all got their tax cuts entrenched forever and a day. It was looking like another manufactured dip is underway here with the new round of stalled tariffs but we could be seeing another attempted breakout above 6300 points:
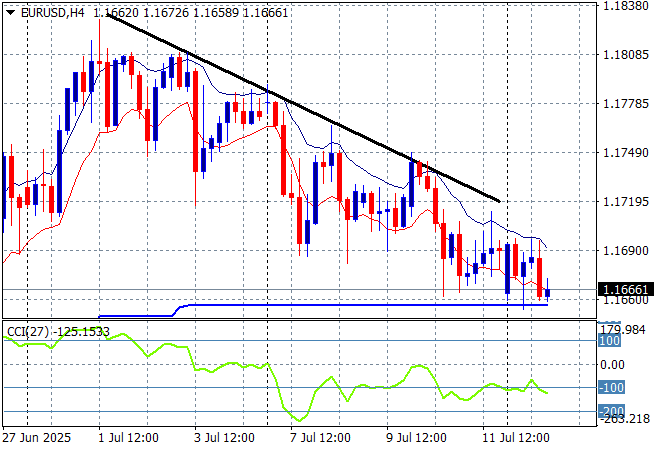
Currency markets are facing some headwinds and confusion around the direction of the Fed, Trump’s tariffs, the Treasury market as we all await this week’s US CPI print. Euro continues to deflate with a further move below the 1.17 handle after finding some stability on Friday night.
The union currency has been building strength continuously as bad domestic economic news from the US overshadowed any continental slowdown but is reversing that trend. Short term momentum is suggesting a proper reversal so watch support at the 1.1650 mid level next:
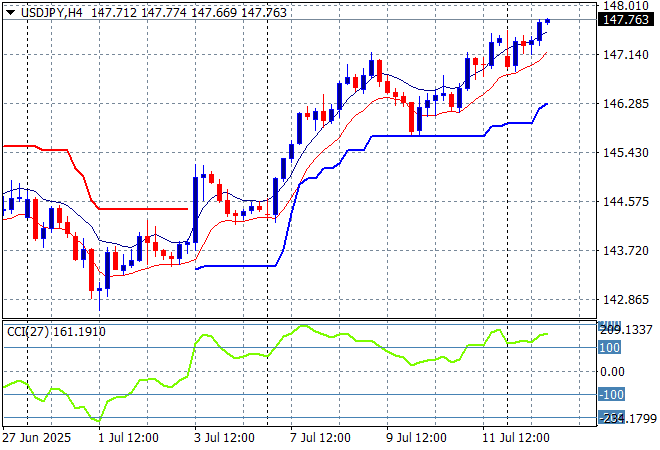
The USDJPY pair recently passed through the 147 handle with a small pullback but found further strength on Friday night as tariff concerns weighed on sensitive export sectors for Japan, and again extended that position overnight.
I still contend we need to watch for any sustained break below the 139 level which completes a multi year bearish head and shoulders setup that could see the 110 to 120 level revisited. However we could see this one off reaction to the NFP and tariffs push into a false rally up to the 148 level just as we did in June, so watch out for TACO:
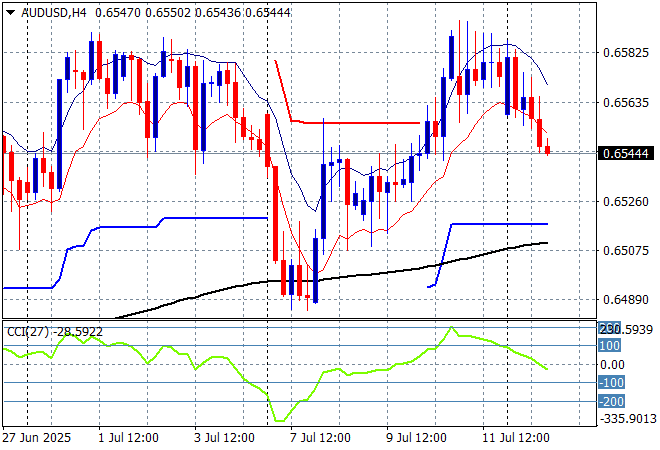
The Australian dollar was relatively weak going into the RBA meeting last week after looking like holding on to the 65 handle and is again finding resistance at the 66 cent level as it begins the new trading week by rolling over on USD strength.
Stepping back for a longer point of view (and looking at the trusty AUDNZD weekly cross) price action has remained supported by the 200 day MA (moving black line) after bouncing off a near new five year low. Keep an eye on temporary support at the 63 cent level and also the series of lower highs in recent weeks of signs of less internal support:
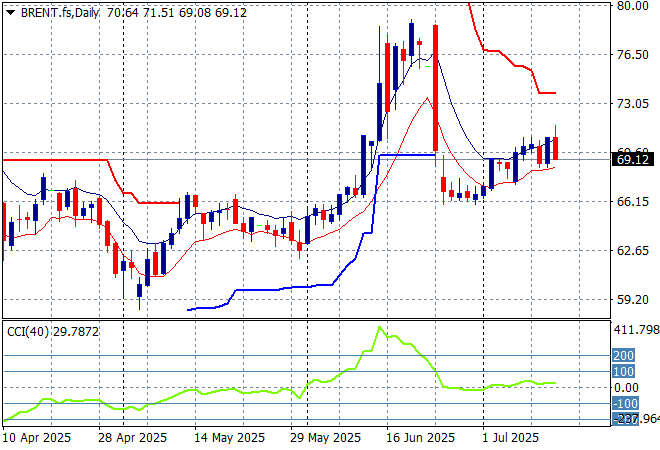
Oil markets were putting in a small bounce on the unexpected spike of OPEC+ production but were slowly slugging along a bit higher on each session. The trend remains slightly up but Brent crude retraced below the $70USD per barrel level overnight.
The daily chart pattern shows the post New Year rally that got a little out of hand and now reverting back to the sideways lower action for the latter half of 2024. The potential for a return to the previous lows is still there if it cannot make a substantive new daily high.
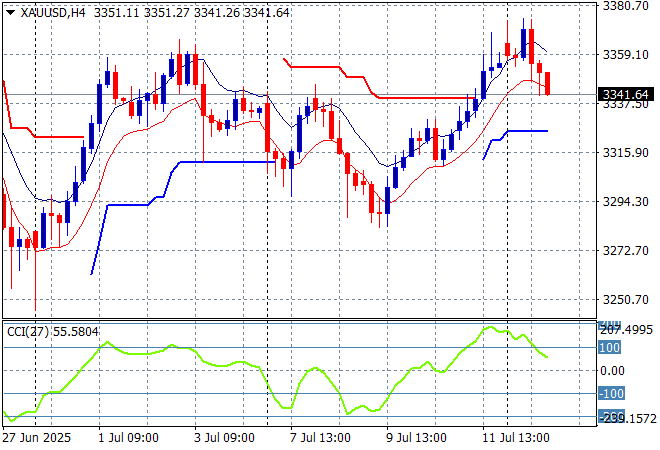
Gold is struggling again but managed to get out of its recent hole to bounce back above the $3300USD per ounce level but lack signs of internal strength as it rolled over again last night.
Short term support has been under threat most of the last three weeks with price almost returning to the late June lows as the USD gains strength. Momentum is retracing back from its slightly overbought position on the short term:
Glossary of Acronyms and Technical Analysis Terms:
ATR: Average True Range – measures the degree of price volatility averaged over a time period
ATR Support/Resistance: a ratcheting mechanism that follows price below/above a trend, that if breached shows above average volatility
CCI: Commodity Channel Index: a momentum reading that calculates current price away from the statistical mean or “typical” price to indicate overbought (far above the mean) or oversold (far below the mean)
Low/High Moving Average: rolling mean of prices in this case, the low and high for the day/hour which creates a band around the actual price movement
FOMC: Federal Open Market Committee, monthly meeting of Federal Reserve regarding monetary policy (setting interest rates)
DOE: US Department of Energy
Uncle Point: or stop loss point, a level at which you’ve clearly been wrong on your position, so cry uncle and get out/wrong on your position, so cry uncle and get out!