
Last night saw the release of the latest US private jobs data which shocked with only a 33K increase over an expected 100K plus, which puts tonight’s NFP print into clear perspective and shows the employment market may not be as robust as Fed Chair Powell thinks. Wall Street ignored the print and focused on the high chance of the Billionaire Tax Bonus Bill getting through the House before the 4th of July holiday but the USD took a hit nonetheless. Pound Sterling was the odd one out on some Gilt shenanigans but recovered in the main while the Australian dollar remains pumped up going into next week’s RBA meeting.
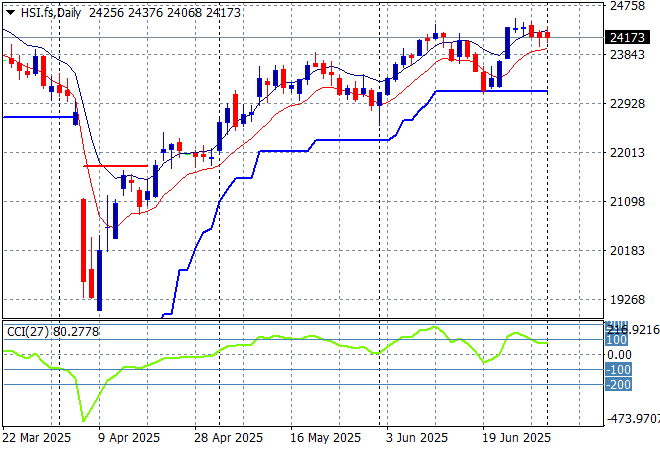
Looking at stock markets from Asia from yesterday’s session, where mainland Chinese share markets were down slightly with the Shanghai Composite remaining above the 3400 point level while the Hang Seng lifted after its holiday in the previous session, closing up 0.6% to get back above the 24000 point level.
The daily chart shows a near complete fill of the March/April selloff although momentum has now reversed after being slightly overbought as price action meets trailing support at the 23000 point level. This was looking like a strong bounceback with firm support at the 23000 point level as a springboard but resistance is building:
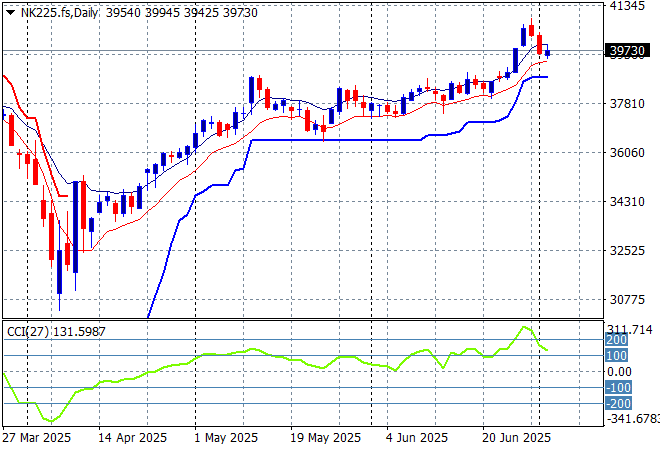
Meanwhile Japanese stock markets were down again on more inflation and trade concerns with the Nikkei 225 off by more than 0.5% to retreat below the 40000 point barrier.
Daily price action was looking very keen indeed as daily momentum has accelerated after clearing resistance at the 36000 point level with another equity market that looks very stretched and breaking out a bit too strongly here. Watch ATR support continue to ratchet up but also for this rally to have a pullback:
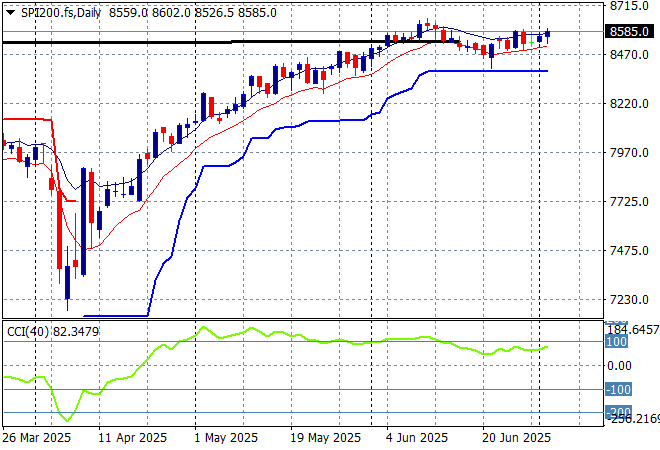
Australian stocks were the best performers with the ASX200 closing 0.6% or so higher at 8597 points. SPI futures are down slightly despite the good mood on Wall Street overnight.
The daily chart pattern is still suggesting further upside is still possible as the inverted head and shoulders pattern is nearly complete with the RBA cut helping boost this but correlation with other risk markets will come into play here – watch as daily momentum has eased off from its slightly overbought status but still very positive:
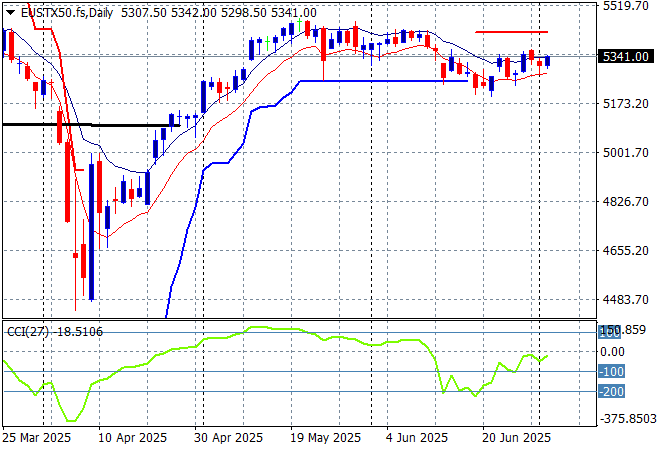
European markets remain in flux with a small reversal across the continent with the Eurostoxx 50 Index closing nearly 0.7% higher at 5318 points.
Weekly support hasn’t moved in a few months now indicating a lack of upward momentum with a potential rollover accelerating as daily momentum remains oversold. The market has not broken below the 5200 point level proper so we could see a small rally from here back to the previous highs but confidence is not as outrageous as in America-Land:
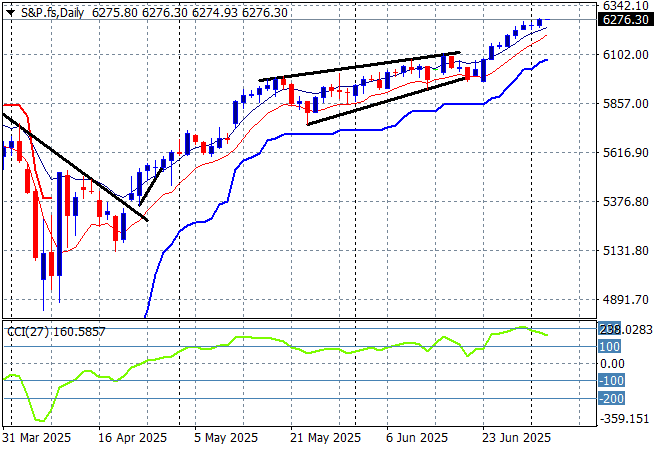
Wall Street is still loving any data, good or bad with the NASDAQ taking back its previous session losses to lift around 0.9% higher while the broader S&P500 closed 0.5% higher, finishing at 6227 points.
The four hourly S&P chart was previously supporting a potential slowdown action here that could be translating to a top on the daily chart as prices fail to get back above the pre-Trump Tariff Tax day. A big beautiful bounceback is seeing the 6000 point level brushed aside as resistance as everyone buys everything:
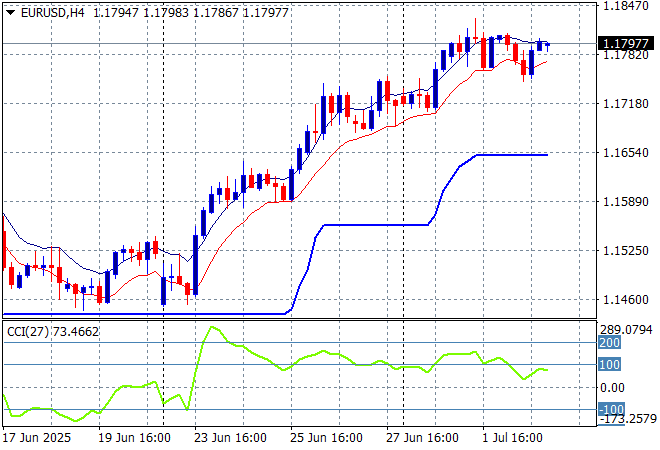
Currency markets continue to sell off King Dollar given the weakening domestic situation in the US although the new Vietnam trade deal saw a modicum of response later in the session. Euro stayed at its new highs to almost breakthrough the 1.18 handle.
The union currency has been building strength continuously as bad domestic economic news from the US overshadowed any continental slowdown. Medium term and short term momentum is still definitely in its favour:
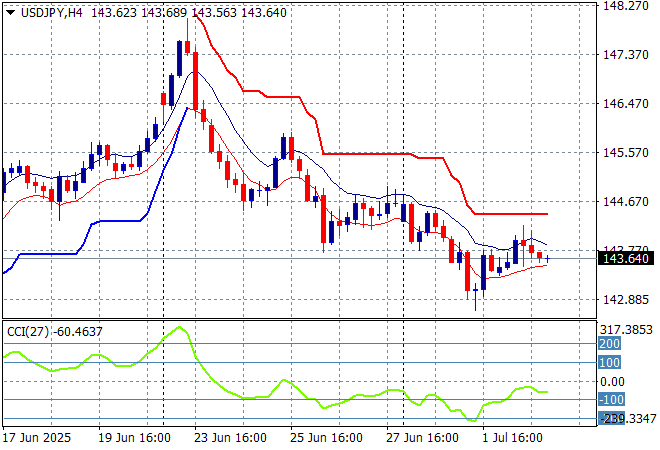
The USDJPY pair remains in the doldrums below the 144 level with momentum waning to the downside as no news of a Japanese trade deal and the threat of further tariffs weighs on the pair.
I still contend we need to watch for any sustained break below the 139 level which completes a multi year bearish head and shoulders setup that could see the 110 to 120 level revisited. This overbought reversal play could have legs down to the mid 144 area to clear out the sinuses first:
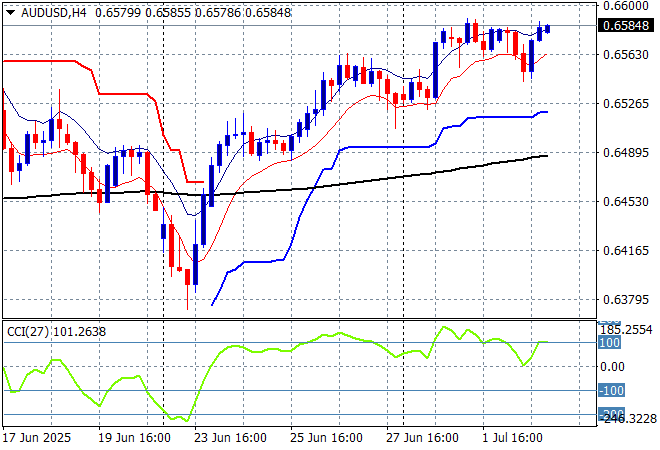
The Australian dollar remains relatively strong after pushing aside significant resistance at the 65 handle holding just below the 66 cent level despite an imminent RBA rate cut.
Stepping back for a longer point of view (and looking at the trusty AUDNZD weekly cross) price action has remained supported by the 200 day MA (moving black line) after bouncing off a near new five year low. Keep an eye on temporary support at the 63 cent level and also the series of lower highs in recent weeks of signs of less internal support:
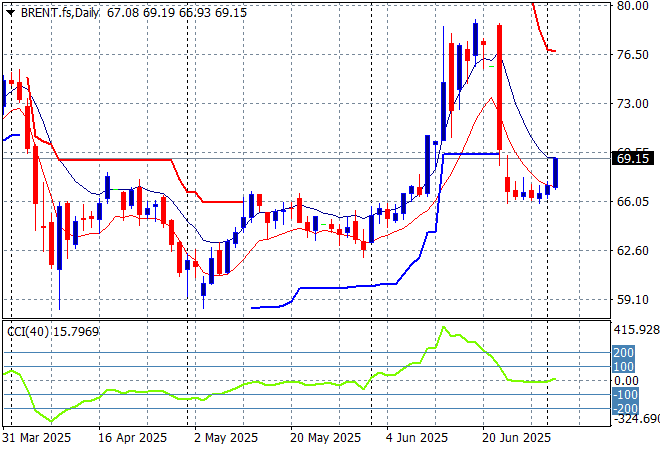
Oil markets have been licking wounds for awhile with Brent crude seeing a lift higher overnight on news of reduction in US oil rigs and volatility around the upcoming OPEC+ meeting with a lift through the $69USD per barrel level.
The daily chart pattern shows the post New Year rally that got a little out of hand and now reverting back to the sideways lower action for the latter half of 2024. The potential for a return to the previous lows is building further:
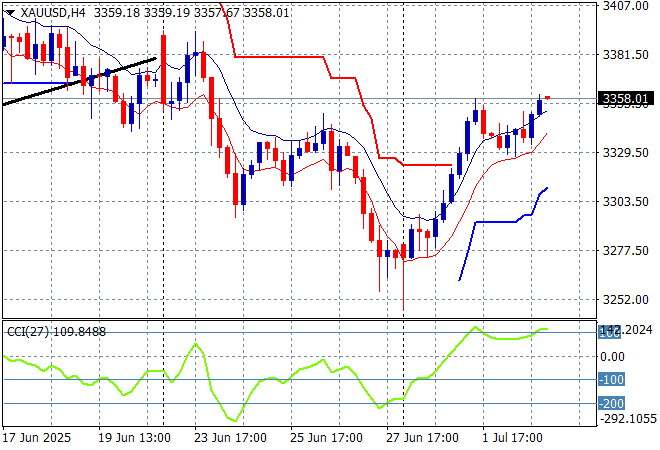
Gold is playing catchup to other undollars as it tries to get back above the $3400USD per ounce level, finding some life overnight by crossing above the $3360 zone.
Short term support had firmed immensely in recent sessions showing real strength but momentum became considerably overbought so this was inevitable as price action has reverted back to the uptrend line from the April lows. The desire to climb back above the recent weekly/monthly highs and still have another crack at the $3400 level is almost gone:
Glossary of Acronyms and Technical Analysis Terms:
ATR: Average True Range – measures the degree of price volatility averaged over a time period
ATR Support/Resistance: a ratcheting mechanism that follows price below/above a trend, that if breached shows above average volatility
CCI: Commodity Channel Index: a momentum reading that calculates current price away from the statistical mean or “typical” price to indicate overbought (far above the mean) or oversold (far below the mean)
Low/High Moving Average: rolling mean of prices in this case, the low and high for the day/hour which creates a band around the actual price movement
FOMC: Federal Open Market Committee, monthly meeting of Federal Reserve regarding monetary policy (setting interest rates)
DOE: US Department of Energy
Uncle Point: or stop loss point, a level at which you’ve clearly been wrong on your position, so cry uncle and get out/wrong on your position, so cry uncle and get out!