
Last night saw the end of the financial year and maybe the ending of the USD dominance in global finance as it had the worst yearly start since 1973, despite multiple undollar central banks cutting rates as safe havens like Swiss Franc, Yen and increasingly Euro and Yuan takeover from King Dollar. Speaking of made up Kings, Trump again slammed major trade partners overnight after bullying Canada, this time hitting Japan with further tariff threats but none of this matters as Wall Street kept climbing to new record highs.
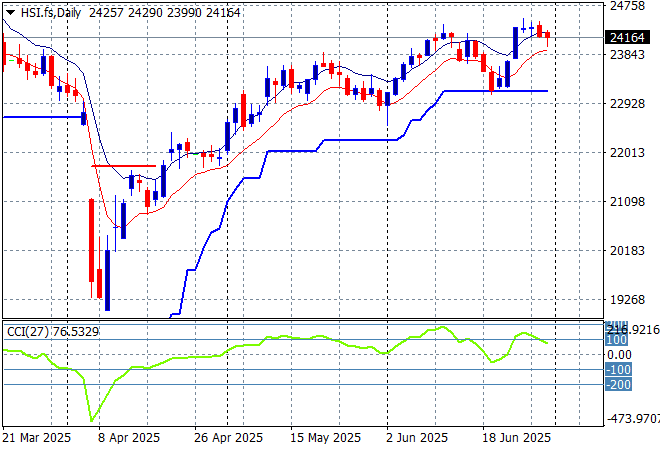
Looking at stock markets from Asia from yesterday’s session, where mainland Chinese share markets were up slightly at first before accelerating higher into the close with the Shanghai Composite extending above the 3400 point level while the Hang Seng Index pulled back around 0.8% or so but still maintaining a position above the 24000 point level.
The daily chart shows a near complete fill of the March/April selloff although momentum has now reversed after being slightly overbought as price action meets trailing support at the 23000 point level. This was looking like a strong bounceback with firm support at the 23000 point level as a springboard but resistance is building:
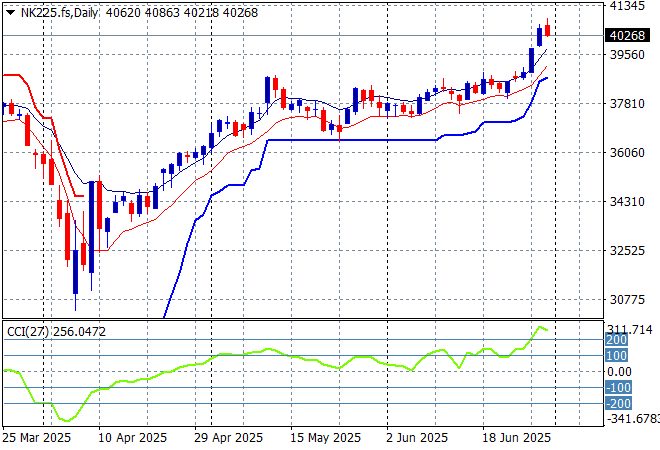
Meanwhile Japanese stock markets are doing very well with the Nikkei 225 lifting more than 0.7% higher to extend further above the 40000 point barrier.
Daily price action was looking very keen indeed as daily momentum has accelerated after clearing resistance at the 36000 point level with another equity market that looks very stretched and breaking out a bit too strongly here. Watch ATR support continue to ratchet up but also for this end-year rally to have a pullback:
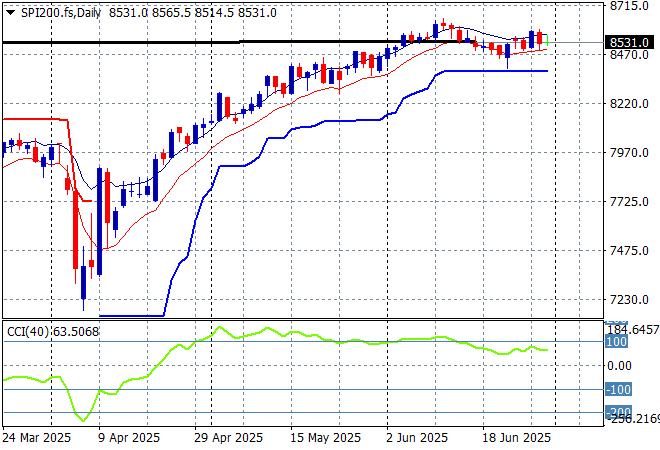
Australian stocks are finally finding some positivity with the ASX200 closing 0.5% higher at 8557 points. SPI futures are down slightly despite the continued rally on Wall Street overnight.
The daily chart pattern is still suggesting further upside is still possible as the inverted head and shoulders pattern is nearly complete with the RBA cut helping boost this but correlation with other risk markets will come into play here – watch as daily momentum has eased off from its slightly overbought status but still very positive:
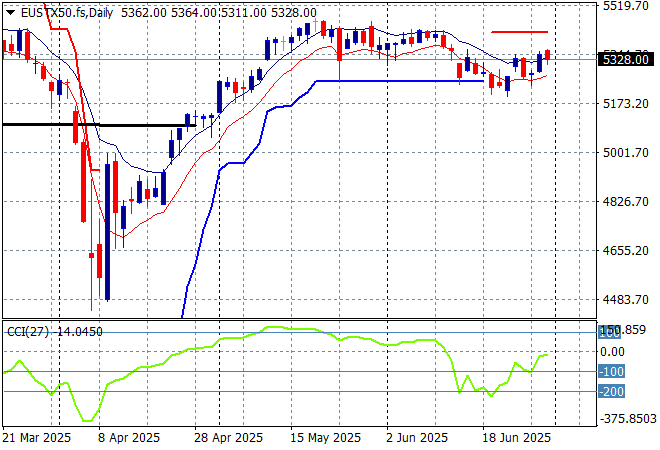
European markets remain in flux with pullbacks across the continent with the Eurostoxx 50 Index closing nearly 0.5% lower at 5303 points with the FTSE also falling a similar amount as the higher domestic currencies hold risk back.
Weekly support hasn’t moved in a few months now indicating a lack of upward momentum with a potential rollover accelerating as daily momentum remains oversold. The market has not broken below the 5200 point level proper so we could see a small rally from here back to the previous highs but confidence is not as ebulliently outrageous as in America-Land:
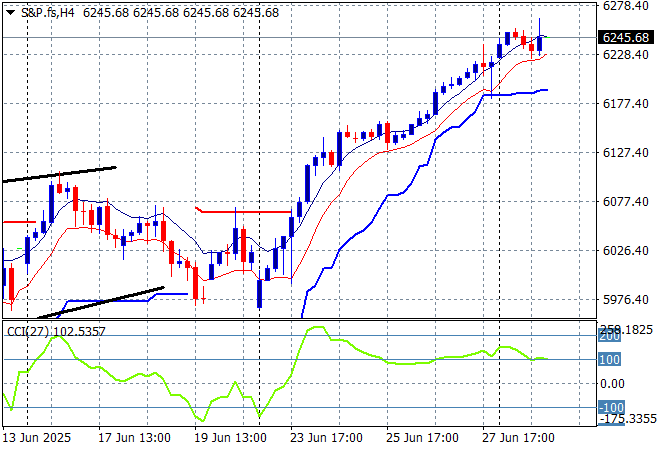
Wall Street is still on the juice and then some with new record highs again as both the NASDAQ and the broader S&P500 closing 0.5% higher, the latter finishing at 6204 points.
The four hourly S&P chart was previously supporting a potential slowdown action here that could be translating to a top on the daily chart as prices fail to get back above the pre-Trump Tariff Tax day. A big beautiful bounceback is seeing the 6000 point level brushed aside as resistance as everyone buys everything:
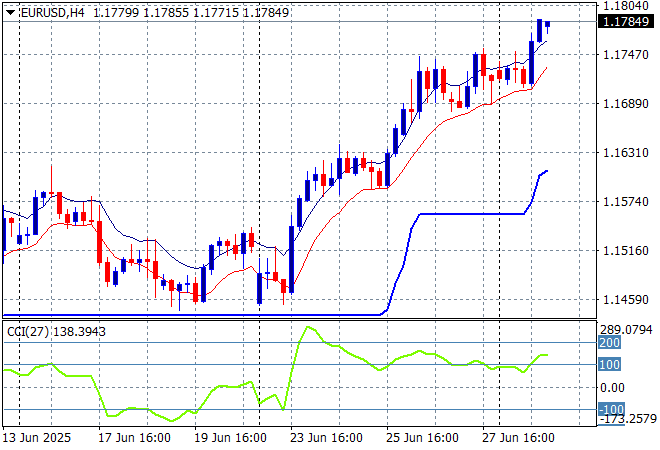
Currency markets continue to sell off King Dollar given the weakening domestic situation in the US and continued uncertainty around the absence of definite trade deals. Euro again broke out to test new highs to almost test the 1.18 handle.
The union currency had been building strength continuously as bad domestic economic news from the US overshadowed any continental slowdown. Medium term and short term momentum is still definitely in its favour:
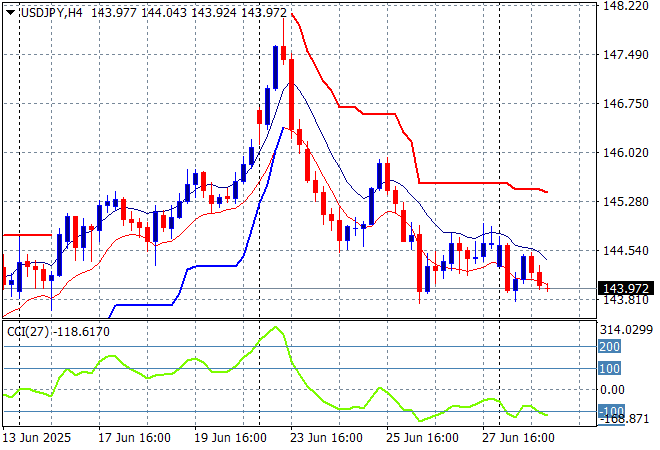
The USDJPY pair remains in the doldrums below the 144 level with momentum waning to the downside as no news of a Japanese trade deal weighs on the pair.
I still contend we need to watch for any sustained break below the 139 level which completes a multi year bearish head and shoulders setup that could see the 110 to 120 level revisited. This overbought reversal play could have legs down to the mid 144 area to clear out the sinuses first:
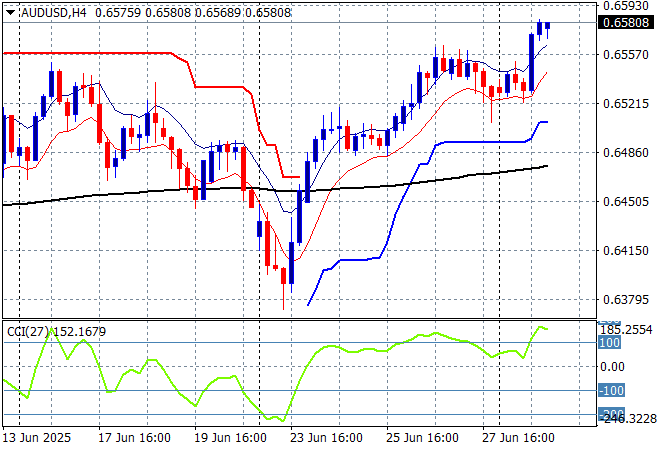
The Australian dollar finally pushed aside significant resistance at the 65 handle with a solid breakout overnight that threatened the 66 cent level despite an imminent RBA rate cut.
Stepping back for a longer point of view (and looking at the trusty AUDNZD weekly cross) price action has remained supported by the 200 day MA (moving black line) after bouncing off a near new five year low. Keep an eye on temporary support at the 63 cent level and also the series of lower highs in recent weeks of signs of less internal support:
Oil markets are still licking wounds mode with both WTI and Brent crude losing small amounts of ground, with the latter marker almost breaking below the $66USD per barrel level with a series of lacklustre sessions.
The daily chart pattern shows the post New Year rally that got a little out of hand and now reverting back to the sideways lower action for the latter half of 2024. The potential for a return to the previous lows is building further:

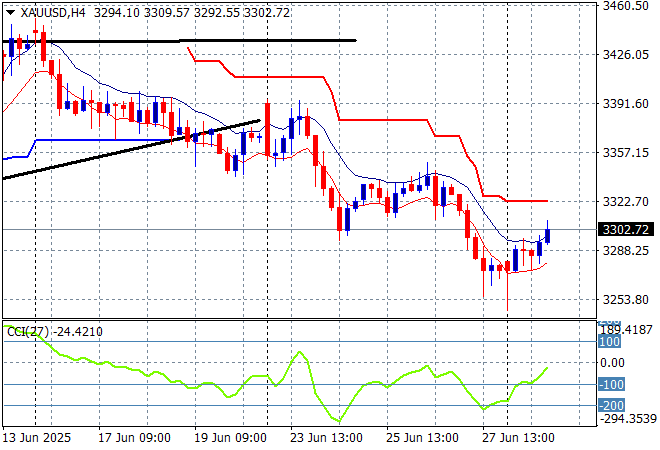
Gold is the one undollar not having a good time as it continues to trend down below the $3400USD per ounce level but it found some life overnight by just crossing above the $3330 zone in a weak rally.
Short term support had firmed immensely in recent sessions showing real strength but momentum became considerably overbought so this was inevitable as price action has reverted back to the uptrend line from the April lows. The desire to climb back above the recent weekly/monthly highs and still have another crack at the $3400 level is almost gone:
Glossary of Acronyms and Technical Analysis Terms:
ATR: Average True Range – measures the degree of price volatility averaged over a time period
ATR Support/Resistance: a ratcheting mechanism that follows price below/above a trend, that if breached shows above average volatility
CCI: Commodity Channel Index: a momentum reading that calculates current price away from the statistical mean or “typical” price to indicate overbought (far above the mean) or oversold (far below the mean)
Low/High Moving Average: rolling mean of prices in this case, the low and high for the day/hour which creates a band around the actual price movement
FOMC: Federal Open Market Committee, monthly meeting of Federal Reserve regarding monetary policy (setting interest rates)
DOE: US Department of Energy
Uncle Point: or stop loss point, a level at which you’ve clearly been wrong on your position, so cry uncle and get out/wrong on your position, so cry uncle and get out!