
If you are curious about the differences in methodology between myself and the usual auction data providers, there is an explanation down the page.
This week brought the strongest results for both Sydney and Melbourne since June 2023.
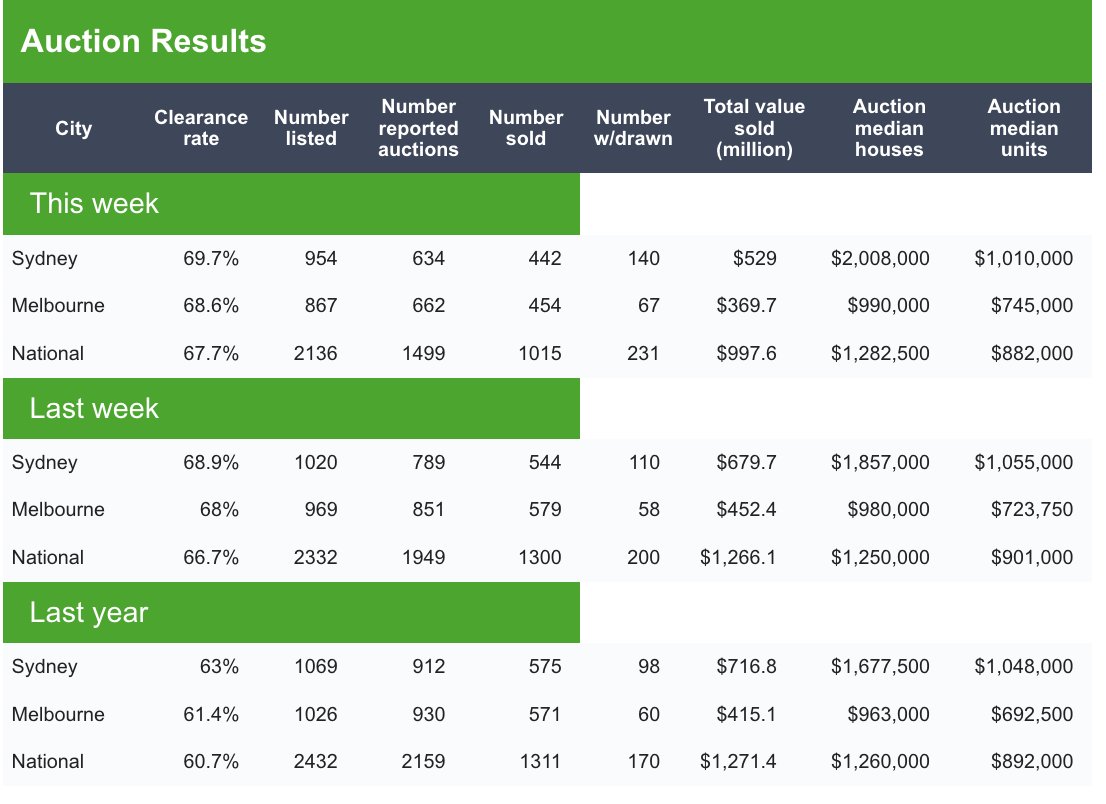
Sydney recorded a sold to listed clearance rate of 48.6%, up from 44.1% last week and significantly above its prior rolling four week average of 43.9%.
Meanwhile, in Melbourne 57.7% of properties scheduled to go under the hammer were reported sold as of the preliminary results being released. This compares with 55.2% last week and a prior four week rolling average of 52.5%.
Adding this data to the four week moving average calculation and the possibility these markets may have shifted into a higher gear is clear.![]()
While I would council taking any single weekend’s results with a pinch of salt, particularly any that is not from the SQM Research gold standard results released during the week, the longer duration rolling average suggests that there is something to this.
Normally by now seasonality has taken over and clearance rates tend to trend down for much of the rest of the year. But that isn’t the way things are playing out.
It’s by no means the rerun of the boom times of 2021, but after accounting for seasonality certainly the strongest single result for both markets in over two years.
It has long been my suspicion that property investors were primed to return to Melbourne market in droves and this adds further weight to that particular theory.
With the expectation of significantly more rates to come later in the year, the consensus expectation is for demand to remain strong.
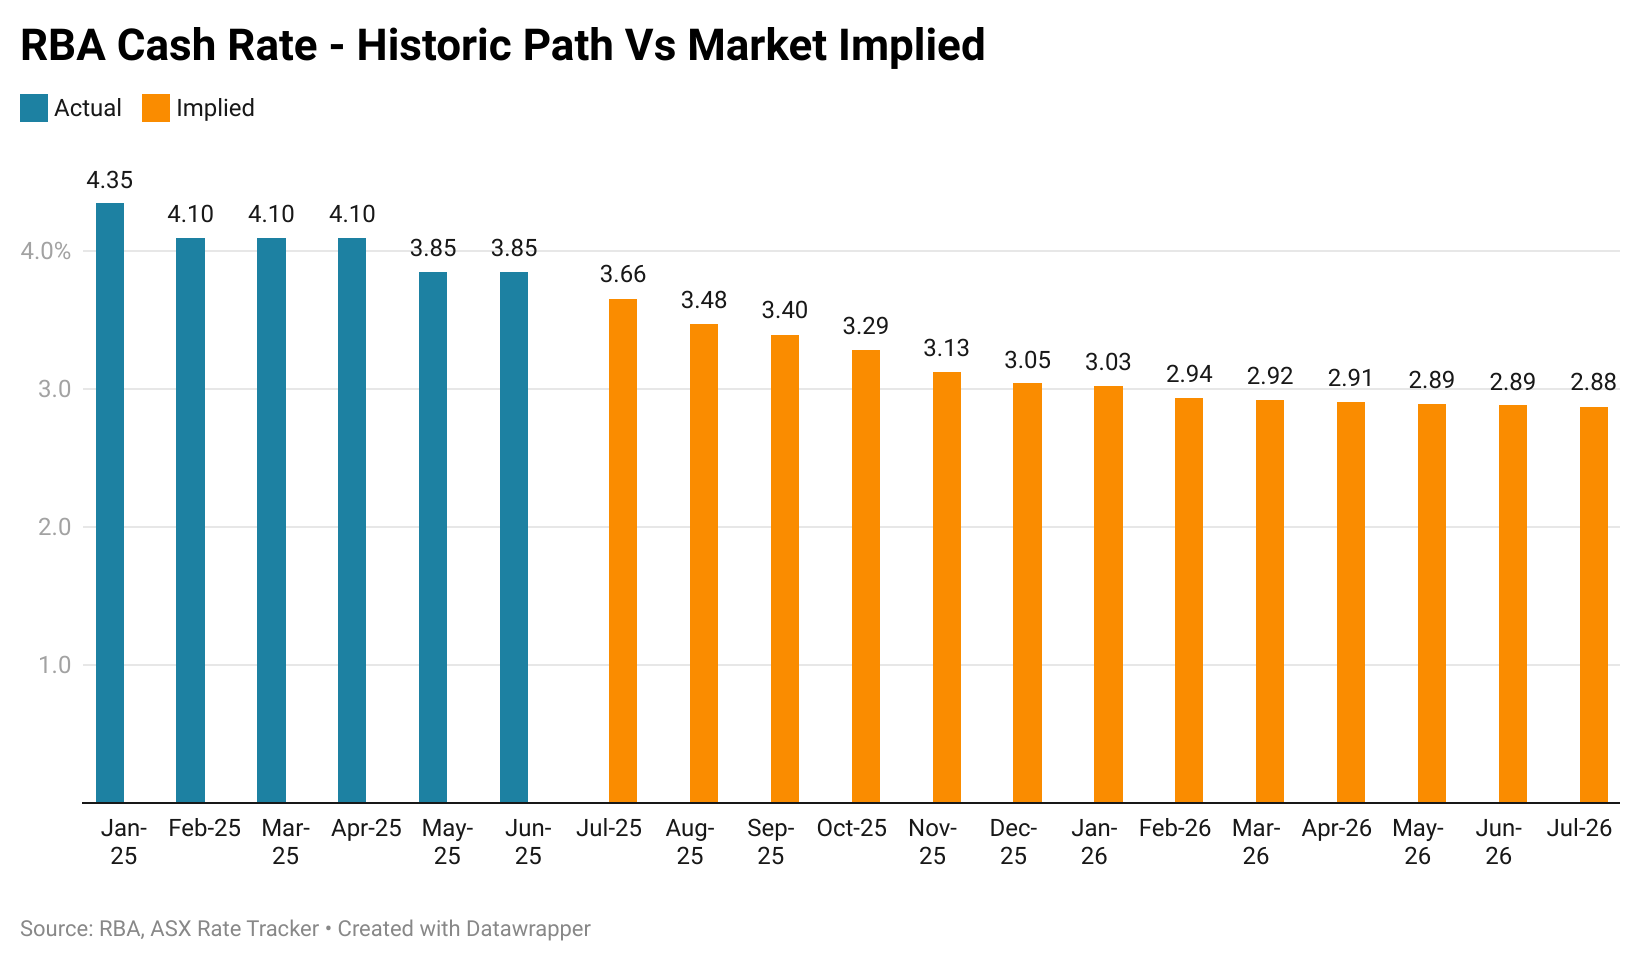
As the year continues to unfold we’ll just have to wait and see how the market balances out the threat of a slowing economy with the prospect of a large series of rate cuts from the RBA.
Methodology Differences
When Domain, Corelogic or any number of other property data sources produce their preliminary auction results on a Saturday evening, it perhaps isn’t based on what one would think at first glance.
Instead of taking the total number properties sold (by whatever means pre-auction or on the day before 5pm) and then dividing it by the total number of properties up for auction, their approach takes the number reported sold and divides it by the number of properties where the agents or auctioneers have provided a result.
This is illustrated in the graphic below from Domain. In Sydney a few weeks ago, 320 out of 954 (33.5%) auction results were unreported as of the time of the publishing of the preliminary figures. In Melbourne, where the market is performing significantly more strongly than Sydney than the Domain results would suggest 205 out of 867 (23.6%) were missing.
As one might imagine some agents are less than thrilled about reporting their failure to sell a property, so the results simply go missing. On some auction weekends where the market isn’t having a great time, well over 1/3 of results simply don’t get reported.
When the market is extremely hot as it was in 2021, then the unreported rate drops well into single digit percentages.
This issue has been well covered by property sector expert and industry veteran, Louis Christopher, the Managing Director of SQM Research.
It’s worth noting that the gold standard for hard data auction results comes from SQM on the Tuesday following the auction weekend. You can find that here.
