
Today we have the auction results for the two biggest markets Sydney and Melbourne, but using a bit of a different approach.
When Domain, Corelogic or any number of other property data sources produce their preliminary auction results on a Saturday evening, it perhaps isn’t based on what one would think at first glance.
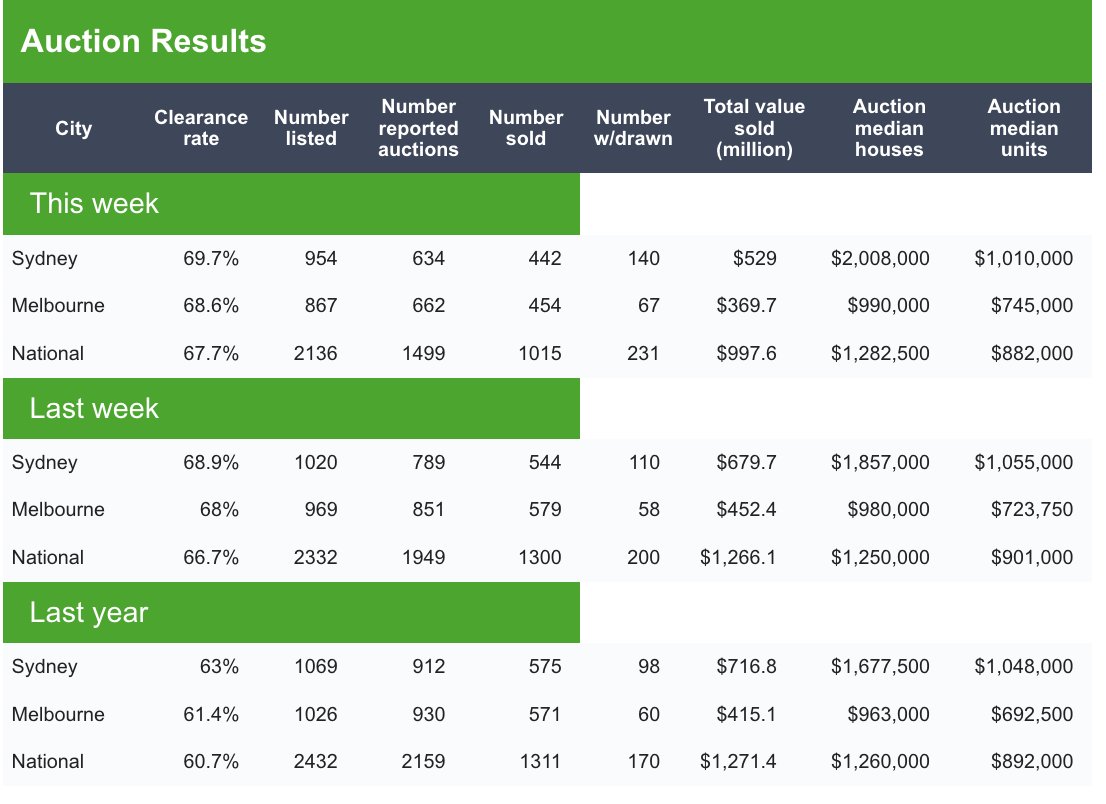
Instead of taking the total number properties sold (by whatever means pre-auction or on the day before 5pm) and then dividing it by the total number of properties up for auction, their approach takes the number reported sold and divides it by the number of properties where the agents or auctioneers have provided a result.
This is illustrated in the graphic below from Domain. In Sydney last week, 320 out of 954 (33.5%) auction results were unreported as of the time of the publishing of the preliminary figures. In Melbourne, where the market is performing significantly more strongly than Sydney than the Domain results would suggest 205 out of 867 (23.6%) were missing.
As one might imagine some agents are less than thrilled about reporting their failure to sell a property, so the results simply go missing. On some auction weekends where the market isn’t having a great time, well over 1/3 of results simply don’t get reported.
When the market is extremely hot as it was in 2021, then the unreported rate drops well into single digit percentages.
This issue has been well covered by property sector expert and industry veteran, Louis Christopher, the Managing Director of SQM Research.
Before we get into how my approach to auction clearance rates functions, it’s worth noting that the gold standard for hard data auction results comes from SQM on the Tuesday following the auction weekend. You can find that here.
A Different Approach
Where Domain, Corelogic and the other property data providers calculate their figures based on what is reported by agents, my numbers take the total number of properties sold and simply divides it by the number of scheduled auctions. I have been collecting data using this metric since before the pandemic, so the comparable data set has become sizable with time.
While this figure will always underestimate the final clearance rate produced by SQM on a Tuesday, it tends to avoid the huge swings in the spread between Domain/Corelogic results and those provided by SQM.
The Results
To put today’s figures into perspective, the rolling 4 week average for Sydney and Melbourne prior to today’s results is 43.4% and 51.7% respectively.
Today Sydney saw clearance rates drop by 2.2 percentages points, recording a figure of 44.1%, compared with 46.3% last week.
Meanwhile in Melbourne, the market was much much stronger, rising by 3.1 percentage points compared with last week to its highest level since June 2023.
It’s my suspicion that property investors increasingly have the Melbourne market in their crosshairs as the premium held by Melbourne compared with the smaller capitals continues to evaporate.
