
There’s no greater example of the disconnect of stock markets with economic reality with Wall Street surging overnight to almost historic highs on the back of a worsening Q1 GDP print and signs that Q2 will show the number 1 economy is in a full recession. What is reflecting reality are currency markets with the USD continued to be sold off despite many undollar central banks cutting their own rates to cope with the Trump regime’s tariffs – with news overnight of non existent deals with Europe and China and that the July 9 deadline is just another TACO – not helping King Dollar either. Treasury yields pulled back slightly again with the 10 year just above the 4.2% level while oil prices moderated slightly but are still near their recent lows.
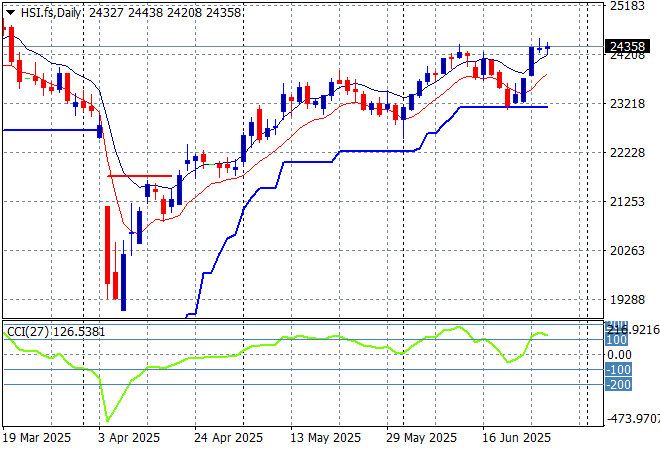
Looking at stock markets from Asia from yesterday’s session, where mainland Chinese share markets are in flux in afternoon trade as the Shanghai Composite steadies above the 3400 point level while the Hang Seng Index has fallen back some 0.8% but is still maintaining a strong position above the 24000 point level.
The daily chart shows a near complete fill of the March/April selloff although momentum has now reversed after being slightly overbought as price action meets trailing support at the 23000 point level. This looks like a strong bounceback with firm support at the 23000 point level as a springboard:
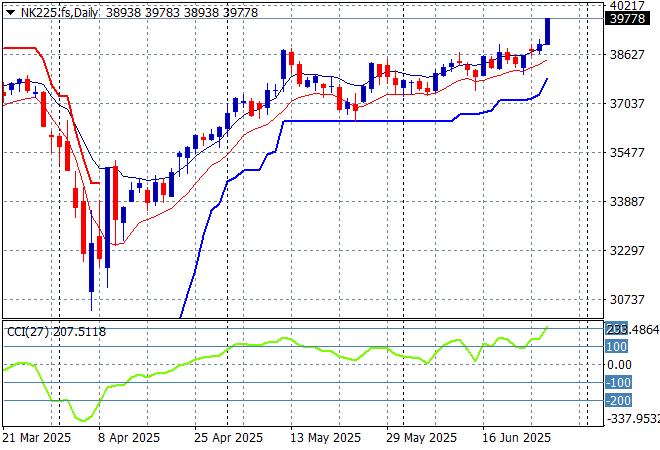
Meanwhile Japanese stock markets are doing very well with the Nikkei 225 lifting more than 1.5% higher to close at 39584 points.
Daily price action was looking very keen indeed although daily momentum has slowed down somewhat last week after clearing resistance at the 36000 point level with another equity market that looks stretched and ready to rollover again here. Watch ATR support closely which appears to be firming in recent sessions:
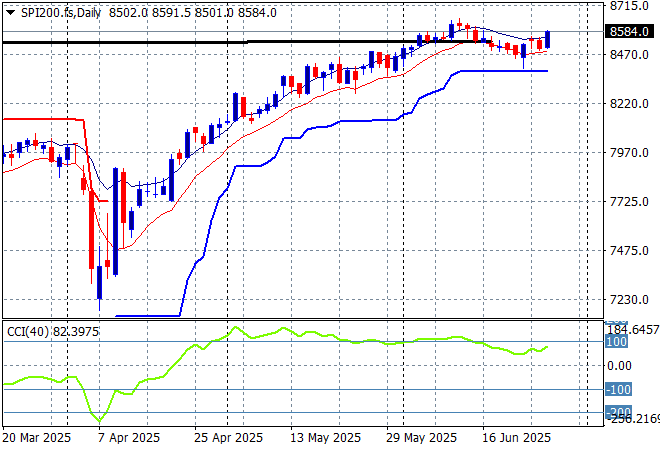
Australian stocks still can’t find much positivity with the ASX200 closing dead flat at 8554 points. SPI futures however are up 0.6% due to the surge on Wall Street overnight.
The daily chart pattern is still suggesting further upside is still possible as the inverted head and shoulders pattern is nearly complete with the RBA cut helping boost this but correlation with other risk markets will come into play here – watch as daily momentum has eased off from its slightly overbought status but still very positive:
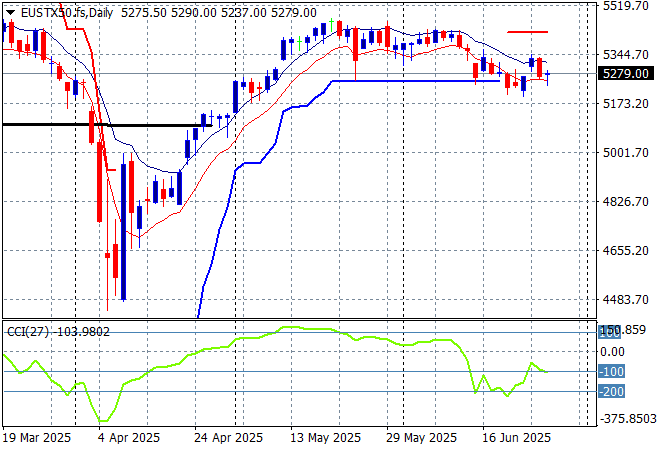
European markets were unable to follow through on their recent bullish catchup plays with the Eurostoxx 50 Index closing nearly 0.2% lower at 5244 points although the FTSE finally put some runs on the board but it seems domestic currency strength is holding both markets back.
Weekly support hasn’t moved in a few months now indicating a lack of upward momentum with a potential rollover accelerating as daily momentum remains oversold. The market has not broken below the 5200 point level proper so we could see a small rally from here back to the previous highs but confidence appears to be disappearing:
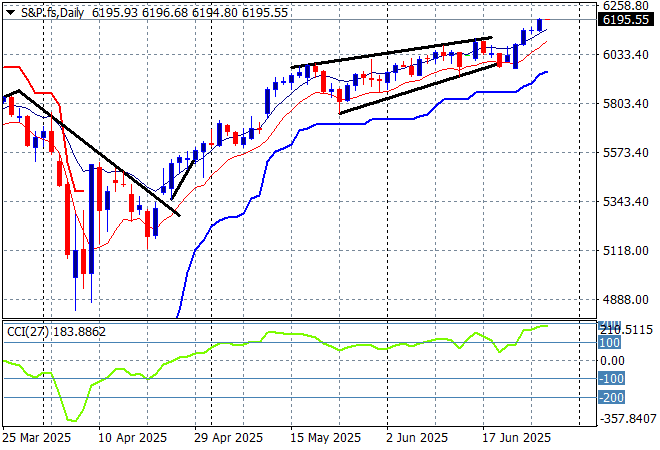
Wall Street was able to continue its own rally with the NASDAQ up nearly 1% while the broader S&P500 closed 0.8% higher at 6141 points.
The four hourly S&P chart was previously supporting a potential slowdown action here that could be translating to a top on the daily chart as prices fail to get back above the pre-Trump Tariff Tax day. A big beautiful bounceback is seeing the 6000 point level brushed aside as resistance as everyone buys everything:
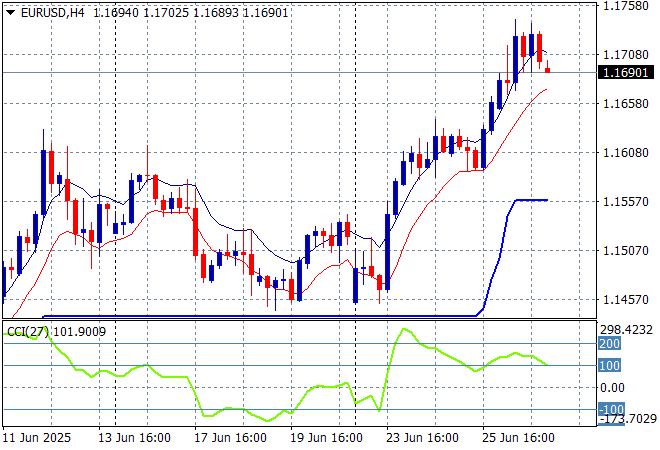
Currency markets continue to sell off King Dollar given the weakening domestic situation in the US with the first quarter GDP revision downgraded further while futures are pushing for more cuts from the Fed than expected. Euro again broke out to test new highs to get well above the 1.17 handle before a small retracement later in the session.
The union currency had been building strength continuously as bad domestic economic news from the US overshadowed any continental slowdown. Medium term momentum was very overbought before the Israeli strike but short term momentum is definitely in its favour:
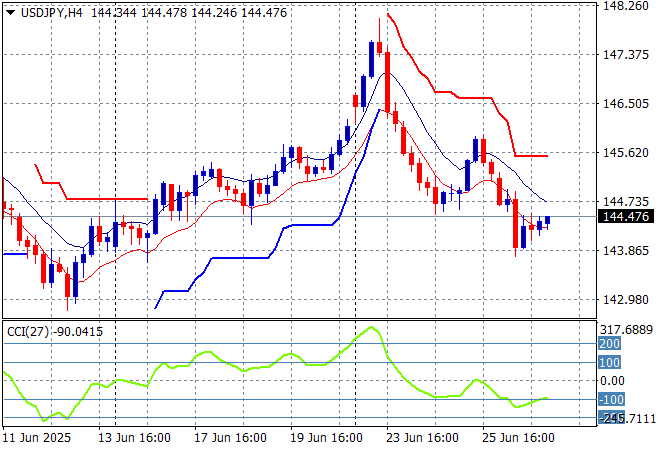
The USDJPY pair has lost its resolve again to flop back to the 144 level overnight with a brief look below as well as no news of a Japanese trade deal weighs on the market.
I still contend we need to watch for any sustained break below the 139 level which completes a multi year bearish head and shoulders setup that could see the 110 to 120 level revisited. This overbought reversal play could have legs down to the mid 144 area to clear out the sinuses first:
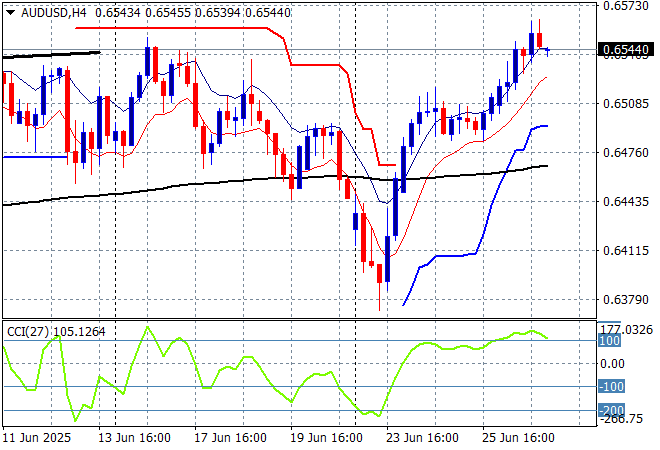
The Australian dollar managed to push aside significant resistance at the 65 handle overnight as it sets up another play at being way too strong for its own good!
Stepping back for a longer point of view (and looking at the trusty AUDNZD weekly cross) price action has remained supported by the 200 day MA (moving black line) after bouncing off a near new five year low. Keep an eye on temporary support at the 63 cent level and also the series of lower highs in recent weeks of signs of less internal support:
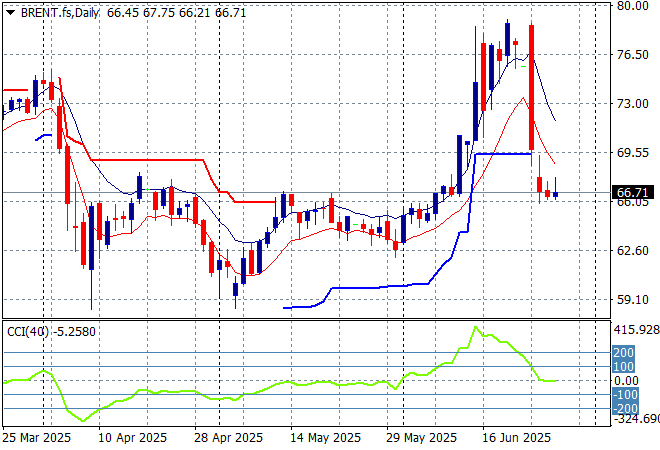
Oil markets are moving from full retreat mode to licking wounds mode with both WTI and Brent crude losing only small amounts of ground overnight, with the latter marker staying below the $67USD per barrel level.
The daily chart pattern shows the post New Year rally that got a little out of hand and now reverting back to the sideways lower action for the latter half of 2024. The potential for a return to the previous lows is building further:
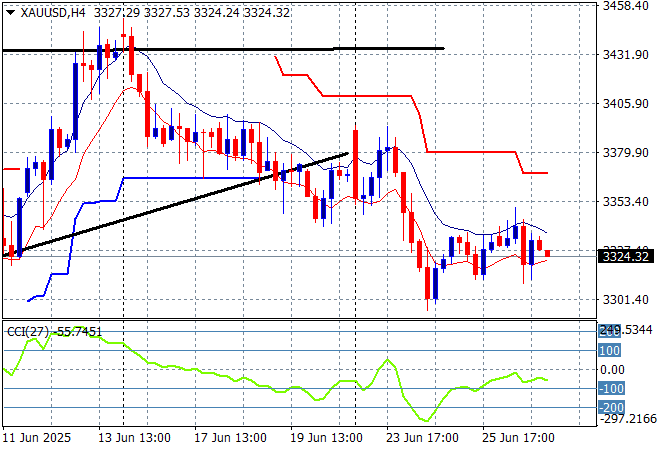
Gold is remaining well below the $3400USD per ounce level but is finding a small amount of internal support as it firms at the $3330 level overnight.
Short term support had firmed immensely in recent sessions showing real strength but momentum became considerably overbought so this was inevitable as price action has reverted back to the uptrend line from the April lows. The desire to climb back above the recent weekly/monthly highs and still have another crack at the $3400 level is almost gone:
Glossary of Acronyms and Technical Analysis Terms:
ATR: Average True Range – measures the degree of price volatility averaged over a time period
ATR Support/Resistance: a ratcheting mechanism that follows price below/above a trend, that if breached shows above average volatility
CCI: Commodity Channel Index: a momentum reading that calculates current price away from the statistical mean or “typical” price to indicate overbought (far above the mean) or oversold (far below the mean)
Low/High Moving Average: rolling mean of prices in this case, the low and high for the day/hour which creates a band around the actual price movement
FOMC: Federal Open Market Committee, monthly meeting of Federal Reserve regarding monetary policy (setting interest rates)
DOE: US Department of Energy
Uncle Point: or stop loss point, a level at which you’ve clearly been wrong on your position, so cry uncle and get out/wrong on your position, so cry uncle and get out!