
Everything is awesome as a potential ceasefire in the Middle East is underway, following an Iranian attack on a US military base in Qatar was thwarted. This has sent risk significantly higher, dumping USD and oil prices in the process, negating all the fallout from the entry of the Trump regime into the war. Euro led the way against King Dollar while the Australian dollar bounced back above the mid 64 cent level after recently making a new weekly low. Treasury yields also pulled back slightly with the 10 year down to the 4.3% level.
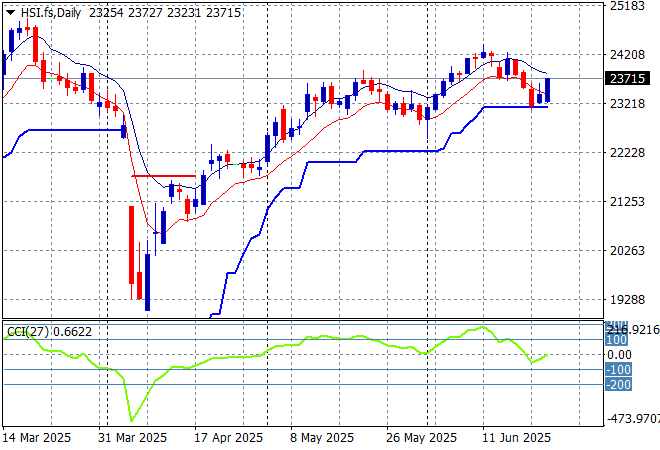
Looking at stock markets from Asia from yesterday’s session, where mainland Chinese share markets were up sharply in afternoon trade as the Shanghai Composite lifted more than 0.6% to almost get back above the 3400 point level while the Hang Seng Index has gained nearly 0.7% to close at 23647 points.
The daily chart shows a near complete fill of the March/April selloff although momentum has now reversed after being slightly overbought as price action meets trailing support at the 23000 point level. Watch for any further closes below the low moving average or trailing ATR for signs of a rollover:
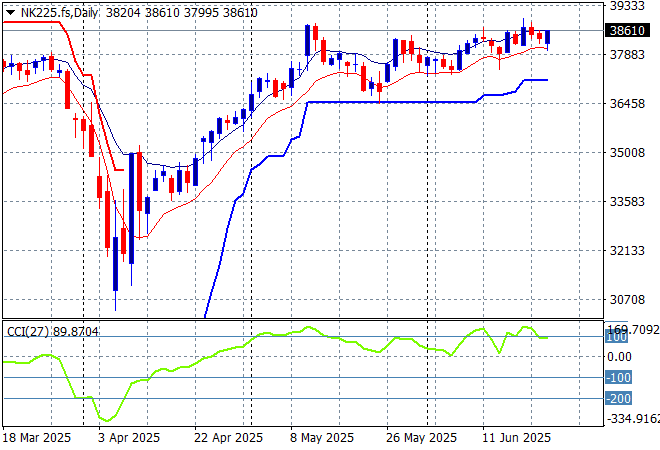
Meanwhile Japanese stock markets were pulling back slightly in the wake of a much weaker Yen with the Nikkei 225 down only 0.2% to 38354 points.
Daily price action was looking very keen indeed although daily momentum has slowed down somewhat last week after clearing resistance at the 36000 point level with another equity market that looks stretched and ready to rollover again here. Watch ATR support closely which appears to be firming in recent sessions:
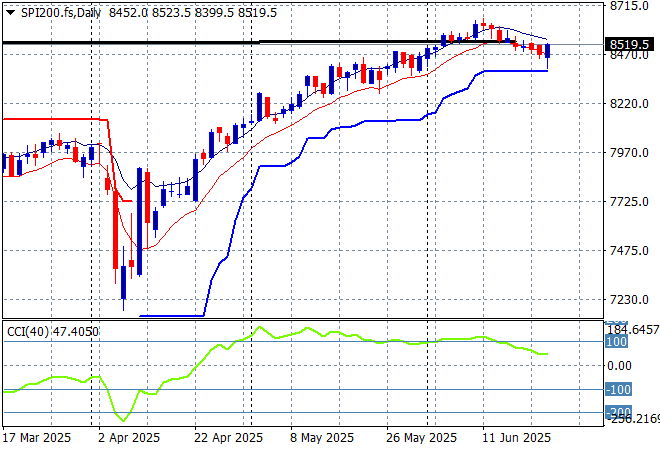
Australian stocks were the worst in the region with the ASX200 closing 0.4% lower at 8474 points. SPI futures however are up more than 0.7% as Wall Street rallied hard overnight.
The daily chart pattern is still suggesting further upside is still possible as the inverted head and shoulders pattern is nearly complete with the RBA cut helping boost this but correlation with other risk markets will come into play here – watch as daily momentum has eased off from its slightly overbought status but still very positive:
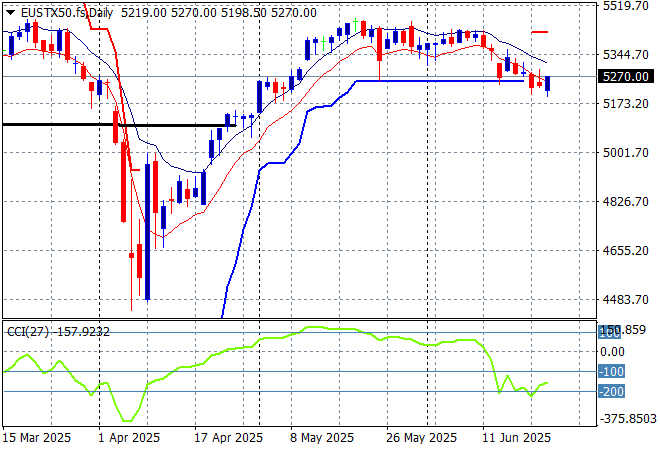
European markets were weak throughout the physical session with the Eurostoxx 50 Index closing nearly 0.2% lower at 5221 points but are seeing gains in post close futures.
Weekly support hasn’t moved in a few months now indicating a lack of upward momentum with a potential rollover accelerating as daily momentum remains oversold. Watch for any significant break below the 5200 point level proper:
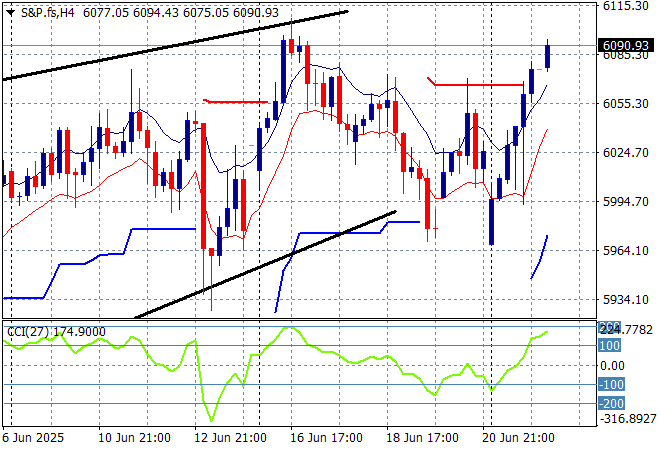
Wall Street loved the missile barrage in Qatar as a sign the Iranians wouldn’t overreact with the NASDAQ and the S&P500 closing nearly 1% higher, the latter finishing at 6025 points.
The four hourly S&P chart was previously supporting a potential slowdown action here that could be translating to a top on the daily chart as prices fail to get back above the pre-Trump Tariff Tax day. A big beautiful bounceback is seeing the 6000 point level brushed aside as resistance as everything returns to normal, for now:
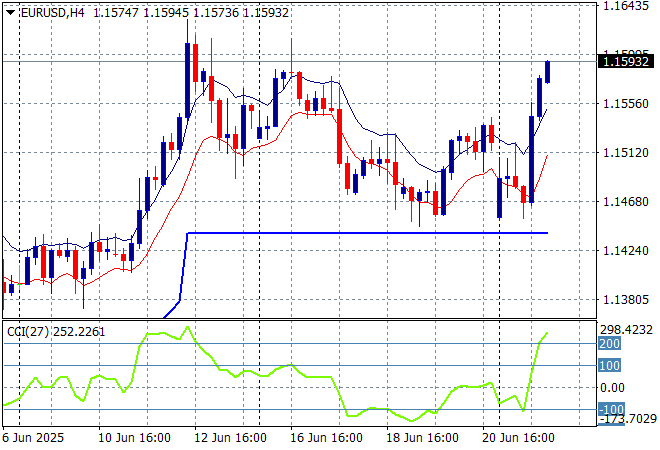
Currency markets were supposed to run to King Dollar given the widening war in the Middle East but have given the USD the flick and bounced straight back into undollars with Euro recovering well above the 1.15 level – almost breaking into the 1.16 handle – after recently making a new weekly low.
The union currency had been building strength continuously as bad domestic economic news from the US overshadowed any continental slowdown. Medium term momentum was very overbought before the Israeli strike so this reversal is not unexpected.
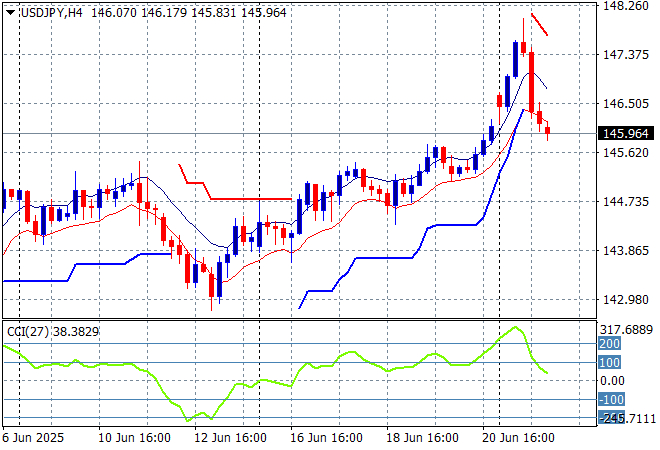
The USDJPY pair was coming back on USD strength as it continued through the 146 handle on Friday night but suffered a big reversal overnight with a return below that level after getting well overbought.
I still contend we need to watch for any sustained break below the 139 level which completes a multi year bearish head and shoulders setup that could see the 110 to 120 level revisited. This overbought reversal play could have legs down to the mid 144 area to clear out the sinuses first:
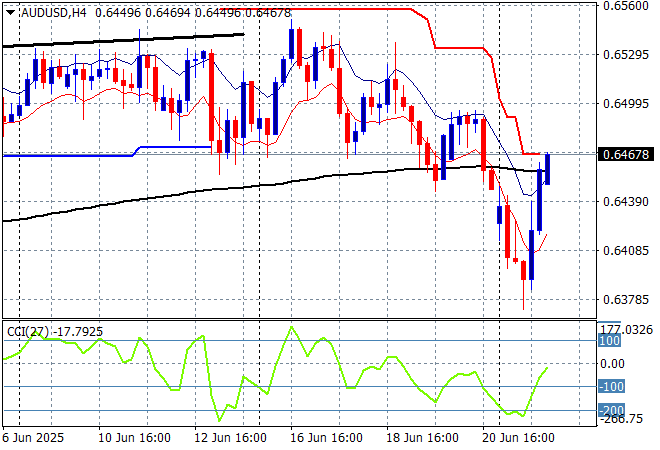
The Australian dollar managed a solid bounceback overnight with a return above the mid 64 cent level to get back above recent support levels after a risk off move to USD.
Stepping back for a longer point of view (and looking at the trusty AUDNZD weekly cross) price action has remained supported by the 200 day MA (moving black line) after bouncing off a near new five year low. Keep an eye on temporary support at the 63 cent level:
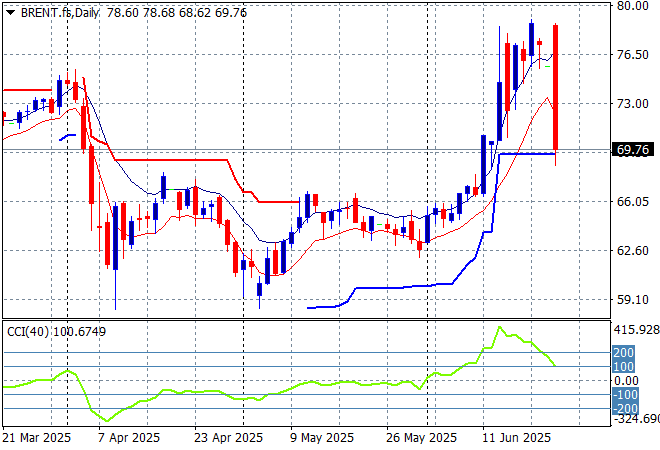
Oil markets are now spiking in volatility but its all the other way as it seems the Iranian threat disappeared overnight with both WTI and Brent crude losing significant value. The latter marker fell straight below the $70USD per barrel level in a huge reversal!
The daily chart pattern shows the post New Year rally that got a little out of hand and now reverting back to the sideways lower action for the latter half of 2024. The potential for a return to the previous lows is now back on track or is it? Watch the Twitter in Chief Tweets next:
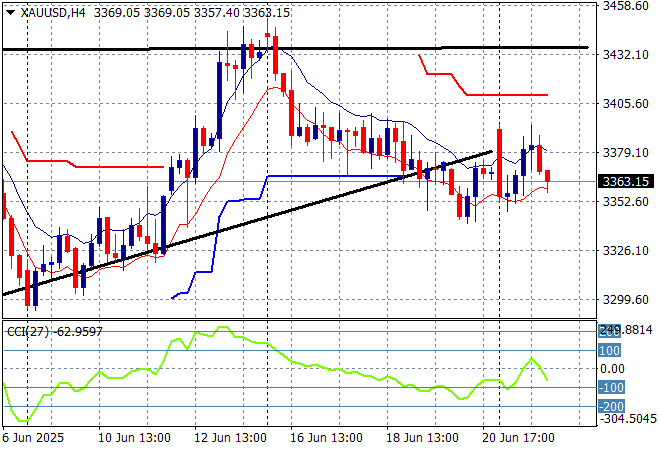
Gold is continuing its slippage below the $3400USD per ounce level as it hovers below its key uptrend line, remaining at the $3360 level overnight.
Short term support had firmed immensely in recent sessions showing real strength but momentum became considerably overbought so this was inevitable as price action has reverted back to the uptrend line from the April lows. The desire to climb back above the recent weekly/monthly highs and still have another crack at the $3400 level is weakening:
Glossary of Acronyms and Technical Analysis Terms:
ATR: Average True Range – measures the degree of price volatility averaged over a time period
ATR Support/Resistance: a ratcheting mechanism that follows price below/above a trend, that if breached shows above average volatility
CCI: Commodity Channel Index: a momentum reading that calculates current price away from the statistical mean or “typical” price to indicate overbought (far above the mean) or oversold (far below the mean)
Low/High Moving Average: rolling mean of prices in this case, the low and high for the day/hour which creates a band around the actual price movement
FOMC: Federal Open Market Committee, monthly meeting of Federal Reserve regarding monetary policy (setting interest rates)
DOE: US Department of Energy
Uncle Point: or stop loss point, a level at which you’ve clearly been wrong on your position, so cry uncle and get out/wrong on your position, so cry uncle and get out!