
Oil prices will gap significantly higher this morning when markets open given the illegal attack on Iran by the Trump regime over the weekend, with equity futures indicating higher volatility as well. This will truly re-set risk markets across the board, with all eyes on US Treasuries for signs this conflagration could have an extreme impact to the US economy. Before the bombings, Friday night saw some hope and stability return to US and European share markets, although Wall Street did end down slightly. The USD had seen some weakness against Euro but is firming against all the other undollars, particularly the Australian dollar which finished below the mid 64 cent level for a new weekly low.
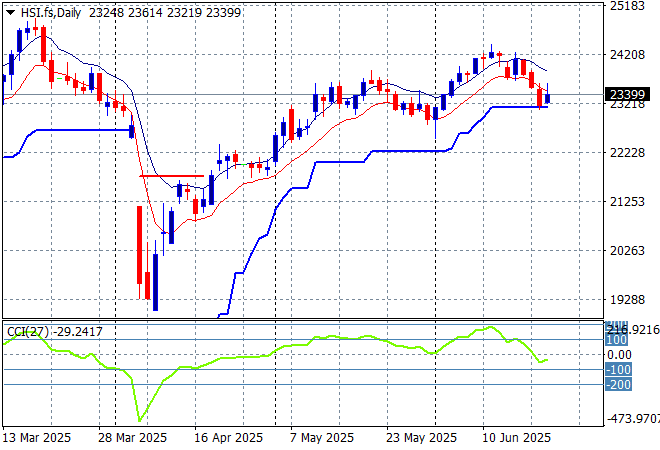
Looking at stock markets from Asia from Friday’s session, where mainland Chinese share markets were hesitant the whole day with the Shanghai Composite finishing flat below the 3400 point level while the Hang Seng Index rebounded after losing ground all week, lifting more than 1% to close at 23530 points.
The daily chart shows a near complete fill of the March/April selloff although momentum has now reversed after being slightly overbought as price action meets trailing support at the 23000 point level. Watch for any further closes below the low moving average or trailing ATR for signs of a rollover:
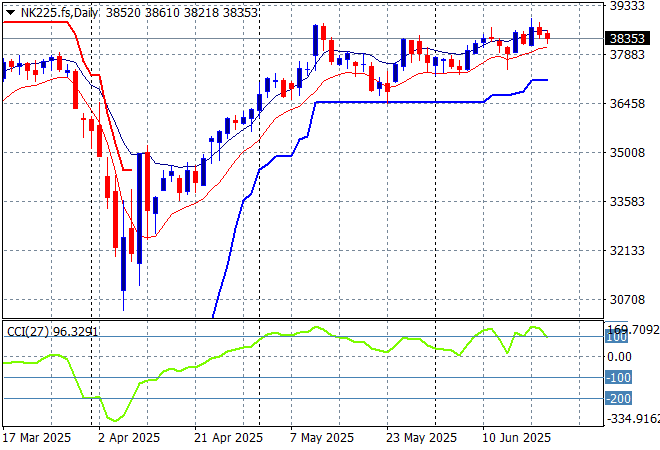
Meanwhile Japanese stock markets were unsure despite the weaker Yen with the Nikkei 225 down more than 0.2% to 38403 points.
Daily price action was looking very keen indeed although daily momentum has slowed down somewhat last week after clearing resistance at the 36000 point level with another equity market that looks stretched and ready to rollover again here. Watch ATR support closely which appears to be firming in recent sessions:
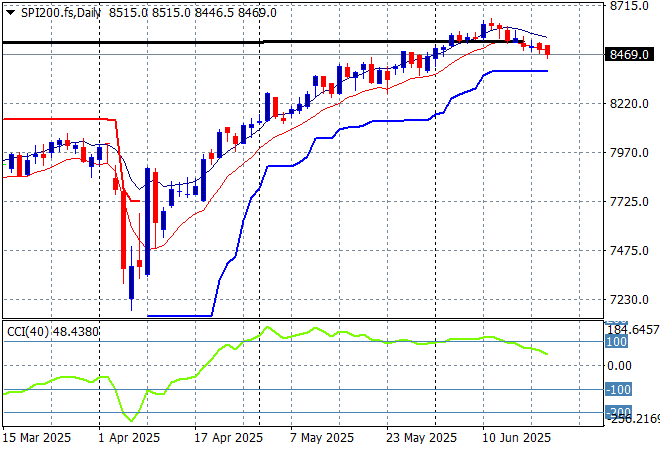
Australian stocks were again in hesitation mode with the ASX200 closing 0.2% lower at 8505 points. SPI futures are down more than 0.3% but I suspect we will see a gap lower on the open.
The daily chart pattern is still suggesting further upside is still possible as the inverted head and shoulders pattern is nearly complete with the RBA cut helping boost this but correlation with other risk markets will come into play here – watch as daily momentum is now quickly rolling over:
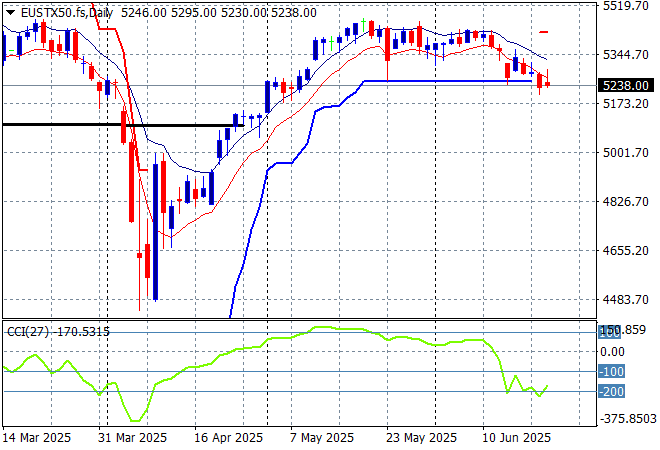
European markets were rolling over after failing to find any positive momentum through the week but Friday saw a small rebound with the Eurostoxx 50 Index closing nearly 0.7% higher at 5233 points.
Weekly support hasn’t moved in a few months now indicating a lack of upward momentum with a potential rollover accelerating as daily momentum remains oversold. Watch for any significant break below the 5200 point level proper:
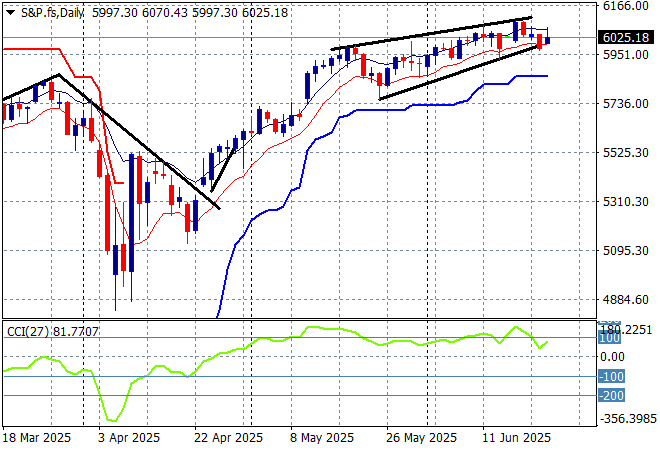
Wall Street reopened from the mid week holiday with the NASDAQ losing more than 0.5% while the S&P500 closed 0.2% lower at 5967 points.
The four hourly S&P chart was previously supporting a potential slowdown action here that could be translating to a top on the daily chart as prices fail to get back above the pre-Trump Tariff Tax day. A rollover is looming here so watch the 6000 point level to turn into resistance:
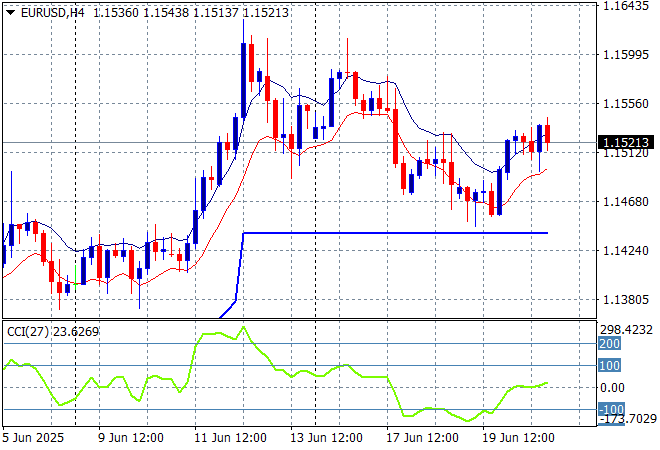
Currency markets are likely to see a strong bid to King Dollar given the widening war in the Middle East on the open this morning, but Friday night saw continued weakness with Euro recovering above the 1.15 level after recently making a new weekly low.
The union currency had been building strength continuously as bad domestic economic news from the US overshadowed any continental slowdown. Medium term momentum was very overbought before the Israeli strike so this reversal is not unexpected. Watch for internal support to break in the short term below the 1.15 level:
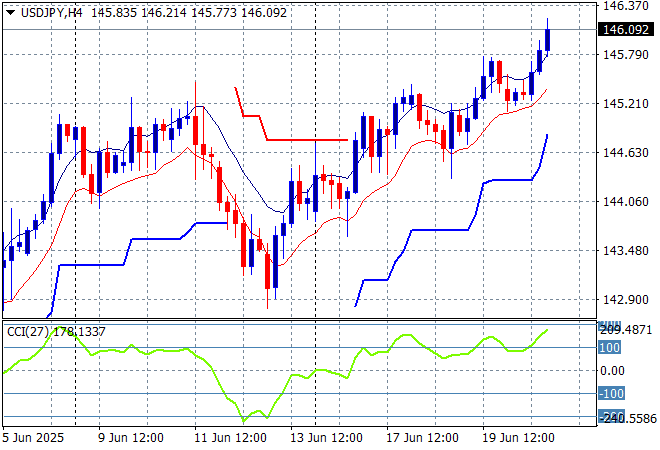
The USDJPY pair is coming back on USD strength as it continued through the 146 handle on Friday night to extend its new weekly and monthly high.
I still contend we need to watch for any sustained break below the 139 level which completes a multi year bearish head and shoulders setup that could see the 110 to 120 level revisited. But for now, short term support is under no pressure here:
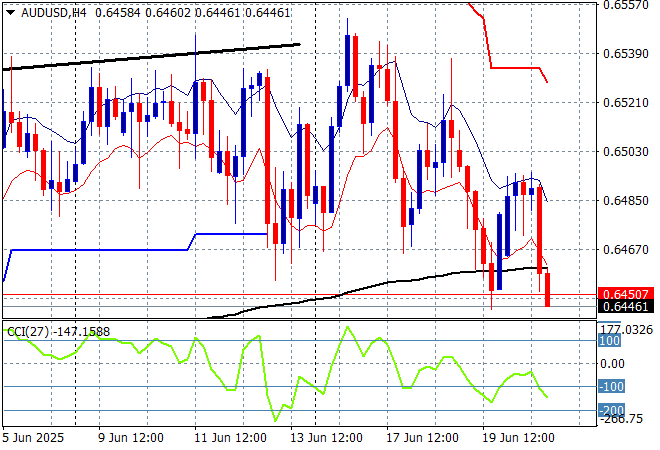
The Australian dollar was showing a lot of internal support on the short and medium term charts as it held around the 65 cent level but has reversed course on the Middle East turmoil and weakening domestic economic data with a continued decline on Friday night.
Stepping back for a longer point of view (and looking at the trusty AUDNZD weekly cross) price action has remained supported by the 200 day MA (moving black line) after bouncing off a near new five year low. Keep an eye on temporary support at the 63 cent level:
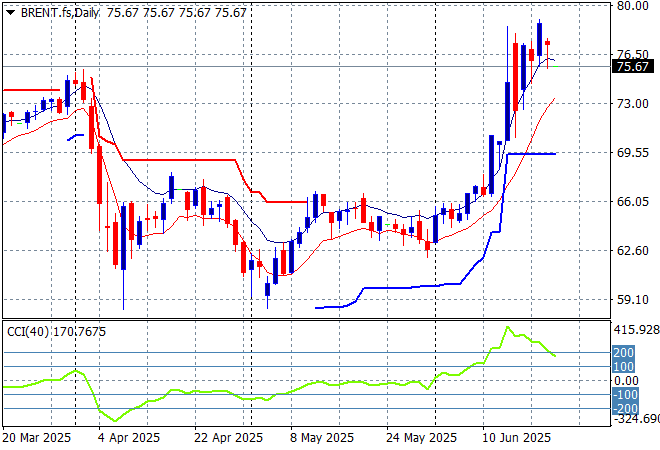
Oil markets are obviously highly volatile and spiked higher again on Friday night with more volatility expected today with Brent crude probably spiking through the $80USD per barrel level or higher – Russia will love this result from Comrade Krasnov!
The daily chart pattern shows the post New Year rally that got a little out of hand and now reverting back to the sideways lower action for the latter half of 2024. The potential for a return to the previous lows is obviously off the table until the conflagration between Tel Aviv and Tehran and Washington (and now Canberra…..sigh) subsides:
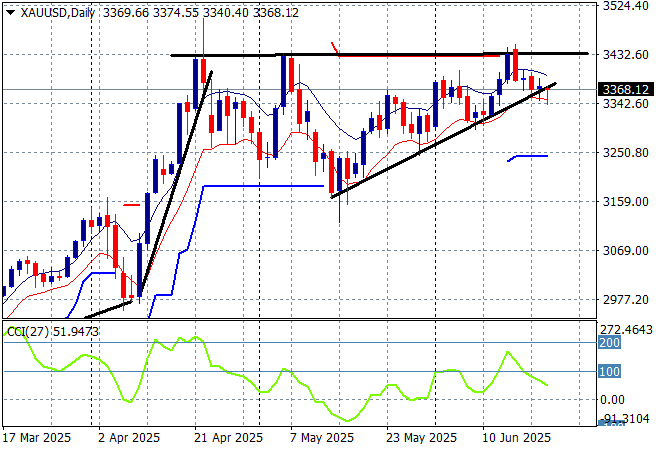
Gold is continuing its slippage below the $3400USD per ounce level as it looks set to cross its key uptrend line, falling back again to the $3360 level on Friday night.
Short term support had firmed immensely in recent sessions showing real strength but momentum became considerably overbought so this was inevitable as price action has reverted back to the uptrend line from the April lows. The desire to climb back above the recent weekly/monthly highs and still have another crack at the $3400 level is weakening:
Glossary of Acronyms and Technical Analysis Terms:
ATR: Average True Range – measures the degree of price volatility averaged over a time period
ATR Support/Resistance: a ratcheting mechanism that follows price below/above a trend, that if breached shows above average volatility
CCI: Commodity Channel Index: a momentum reading that calculates current price away from the statistical mean or “typical” price to indicate overbought (far above the mean) or oversold (far below the mean)
Low/High Moving Average: rolling mean of prices in this case, the low and high for the day/hour which creates a band around the actual price movement
FOMC: Federal Open Market Committee, monthly meeting of Federal Reserve regarding monetary policy (setting interest rates)
DOE: US Department of Energy
Uncle Point: or stop loss point, a level at which you’ve clearly been wrong on your position, so cry uncle and get out/wrong on your position, so cry uncle and get out!