
Friday’s session was dominated by the Israeli-Iranian war with an initial flight to safety to USD that then faded, coupled with an actual rise in Treasury yields. This is not usual in times of high risk and is a symptom of the flailing global monetary order. The 30 year yield finished close to the 5% level again and while Euro and Pound Sterling eventually finished lower they are still near multi month/yearly highs. The Australian dollar is still holding around a locus of control at the 65 cent level.
Oil prices spiked of course with Brent crude almost up to the $80USD per barrel level before retracing back to the pre-tariff Liberation Day $75 zone. Meanwhile gold almost pushed to a new historic high with a strong rally up through to the $3430USD per ounce level.
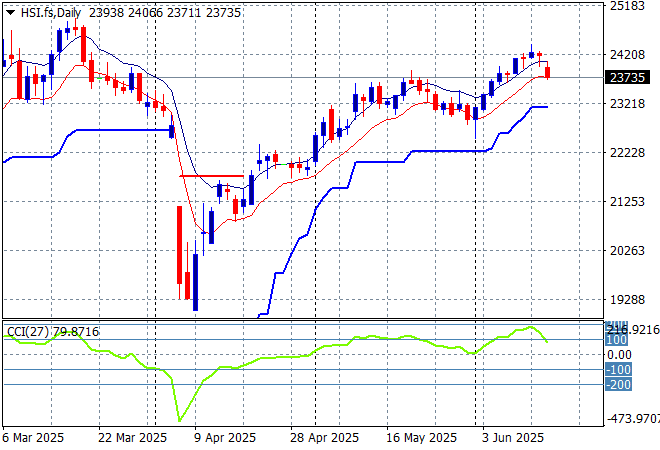
Looking at stock markets from Asia from Friday’s session, where mainland Chinese share markets have fallen back sharply as the Shanghai Composite flopped below the 3400 point level while the Hang Seng Index was down more than 0.6% in afternoon trade to finish below the 24000 point level again.
The daily chart shows a near complete fill of the March/April selloff although momentum is now picking up again and remains slightly overbought as the 90 day “relief” continues without any further positive news. Watch for any crack below the low moving average or 23000 point level that could halt this breakout:
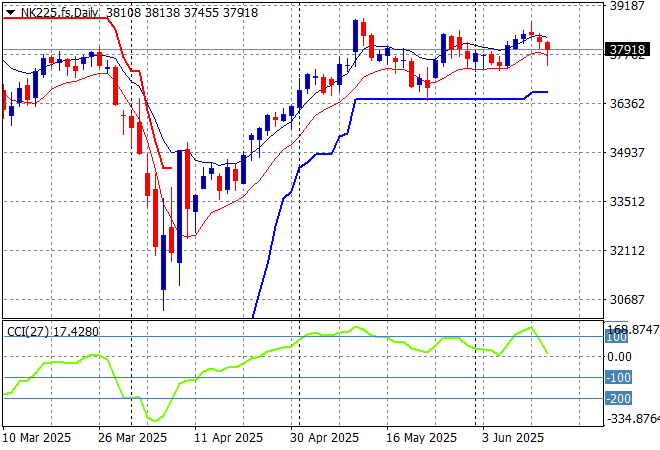
Japanese stock markets also fell back with the Nikkei 225 moving more than 0.9% lower to 37834 points.
Daily price action was looking very keen indeed although daily momentum has slowed down somewhat this week after clearing resistance at the 36000 point level with another equity market that looks stretched and ready to rollover again here. Watch ATR support closely which appears to be firming in recent sessions:
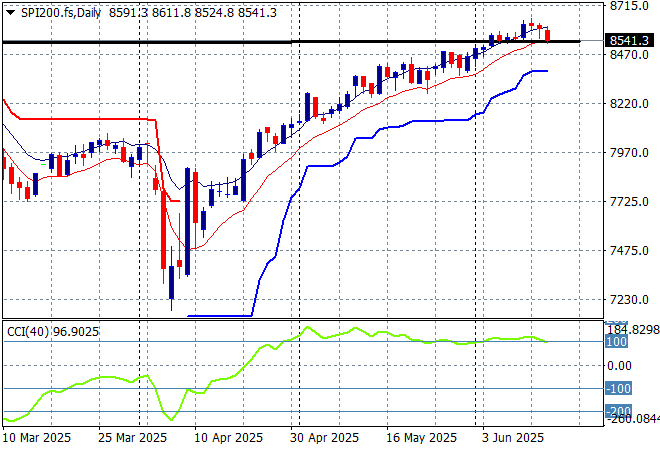
Australian stocks were the best relative performers again with the ASX200 closing some 0.3% lower at 8547 points. SPI futures are down just 0.2% but I expect a steeper fall on the open given the busy weekend of events and the poor showing on Wall Street from Friday night.
The daily chart pattern is still suggesting further upside is still possible as the inverted head and shoulders pattern is nearly complete with the RBA cut helping boost this but correlation with other risk markets will come into play here – watch as daily momentum is now rolling over:
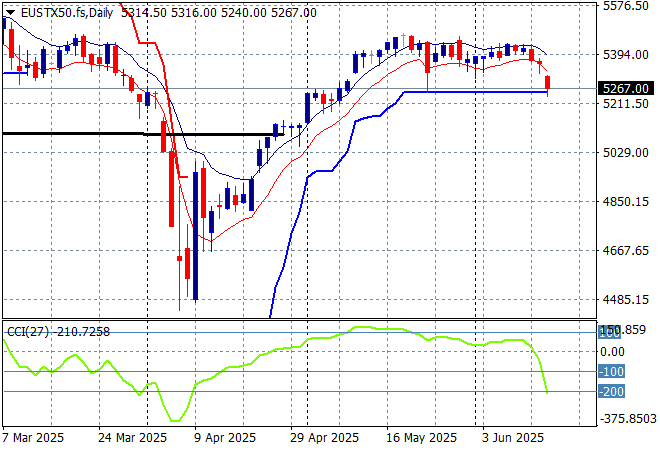
European markets still can’t find any positive momentum as the Israeli/Iranian war heated up with the Eurostoxx 50 Index falling some 1.3% lower to close at 5290 points.
Support at the previous monthly support levels (black line) at 5100 points is now firmly held with the bounce off the 2024 lows at the 4400 point level indicating a massive fill of this dump and pump action with the former February highs nearly complete. A rollover is accelerating here so watch for support at the 5200 point level proper:
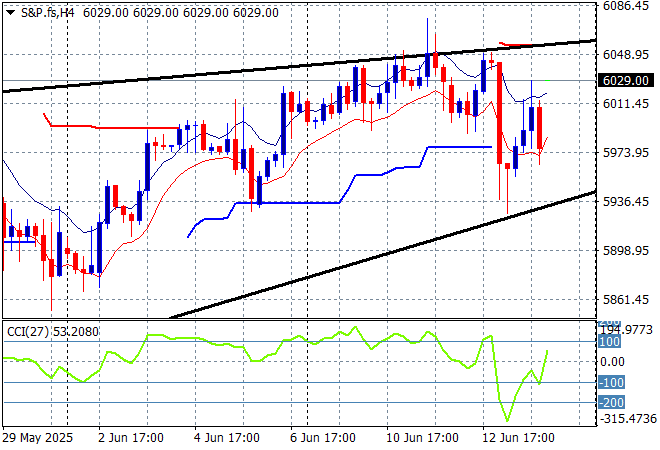
Wall Street seems like its caught in a trap as well with the NASDAQ closing 1.3% lower while the S&P500 was similarly effected, closing 1.1% lower at 5976 points.
The four hourly chart was previously supporting a potential slowdown action here that could be translating to a top on the daily chart as prices try to get back above the pre-Trump Tariff Tax day. Hopium is still giving a lot of support but I would contend that the 6000 point level is now firming as resistance:
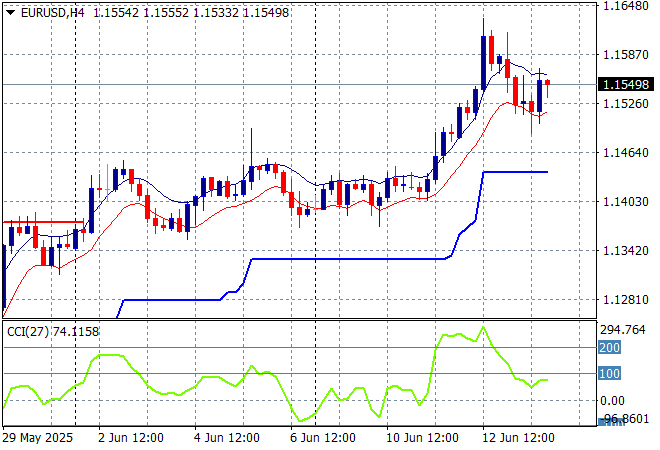
Currency markets remain in an anti-USD mood regardless of the safe haven trade with an initial swing of strength mainly fading towards to the end of the session, with Euro finishing at the mid 1.15 handle after previously breaking through the 1.16 level.
The union currency had been building strength continuously as bad domestic economic news from the US overshadows\ed any continental slowdown with a swift rise above the 1.16 level on the latest weak PPI print and stronger jobless claims. Medium term momentum was very overbought before the Israeli strike so this reversal is not unexpected. Watch for internal support in the short term at the 1.15 level:
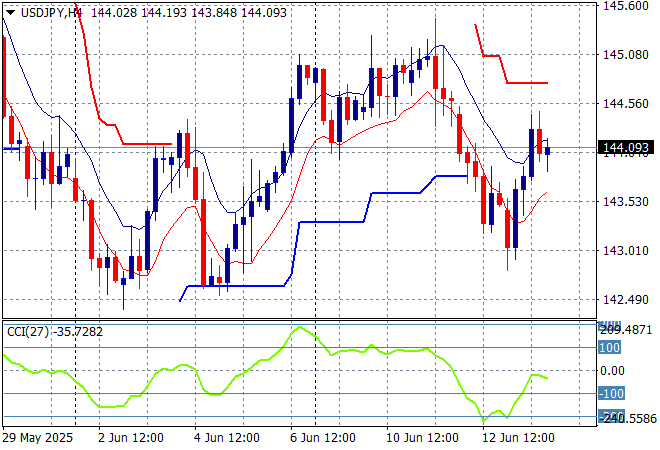
The USDJPY pair saw a small reversal on the safe haven mood but only just got above the 144 level as short term momentum remained in negative settings.
I still contend we need to watch for any sustained break below the 139 level which completes a multi year bearish head and shoulders setup that could see the 110 to 120 level revisited. I’m still watching short term support that could come under pressure here again:
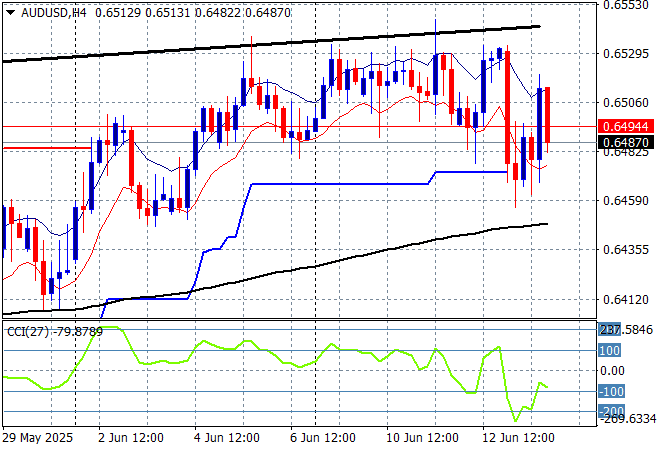
The Australian dollar continues to show a lot of internal support on the short and medium term charts as it holds around the 65 cent level despite a mild pullback following the Middle East turmoil.
Stepping back for a longer point of view (and looking at the trusty AUDNZD weekly cross) price action has remained supported by the 200 day MA (moving black line) after bouncing off a near new five year low. Keep an eye on temporary support at the 63 cent level but this is still looking promising for the Pacific Peso:
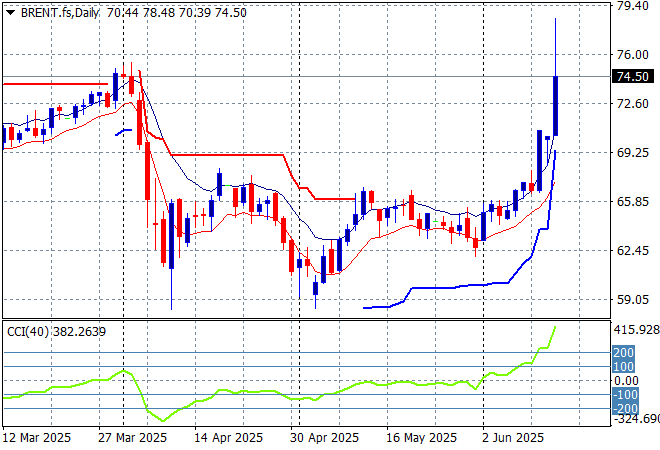
Oil markets had been building stronger following a positive reaction to the previous NFP report but the Iranian attacks have seen both markers soar to new highs with Brent crude spiking well above the $75USD per barrel level before finishing at its early April high at just below the $75 level.
The daily chart pattern shows the post New Year rally that got a little out of hand and now reverting back to the sideways lower action for the latter half of 2024. The potential for a return to the previous lows is obviously off the table until the conflagration between Tel Aviv and Tehran subsides or nukes are exchanged?
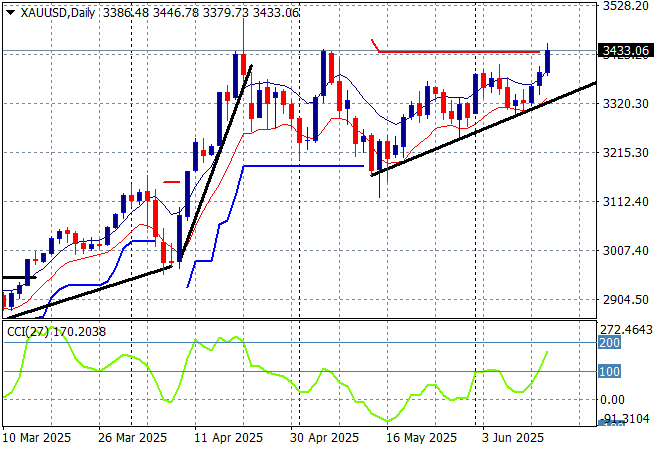
Gold was moving like the other undollars against USD after finding some stability last week but has managed to almost get back above the $3400USD per ounce level.
Short term support had firmed immensely in recent sessions showing real strength but momentum became considerably overbought so this was inevitable as price action has reverted back to the uptrend line from the April lows. However it seems to want to climb above the recent weekly/monthly highs and have another crack at the $3400 level as USD weakens:
Glossary of Acronyms and Technical Analysis Terms:
ATR: Average True Range – measures the degree of price volatility averaged over a time period
ATR Support/Resistance: a ratcheting mechanism that follows price below/above a trend, that if breached shows above average volatility
CCI: Commodity Channel Index: a momentum reading that calculates current price away from the statistical mean or “typical” price to indicate overbought (far above the mean) or oversold (far below the mean)
Low/High Moving Average: rolling mean of prices in this case, the low and high for the day/hour which creates a band around the actual price movement
FOMC: Federal Open Market Committee, monthly meeting of Federal Reserve regarding monetary policy (setting interest rates)
DOE: US Department of Energy
Uncle Point: or stop loss point, a level at which you’ve clearly been wrong on your position, so cry uncle and get out/wrong on your position, so cry uncle and get out!