

A stronger than expected US initial jobless claims print – the third week in a row that was well above expectations – gave bond and currency markets a bit of a shakeup but was overshadowed by increased Iranian tensions with the US and the plainly not-a-deal US-China trade deal. Wall Street still managed to turn those frowns upside down but European markets were having none of it with solid selloffs. The USD fell back against most of the major undollars with Euro in particular putting in a new monthly high above the 1.16 level. The Australian dollar was also stronger than expected and pushed back above the 65 cent level.
Oil prices are holding on to recent strength with both WTI and Brent crude lifting to new levels on increased US/Iranian tensions, with the latter hollding well above the $70USD per barrel level while gold continued its recent bounceback to finish slightly below the $3380USD per ounce level this morning.
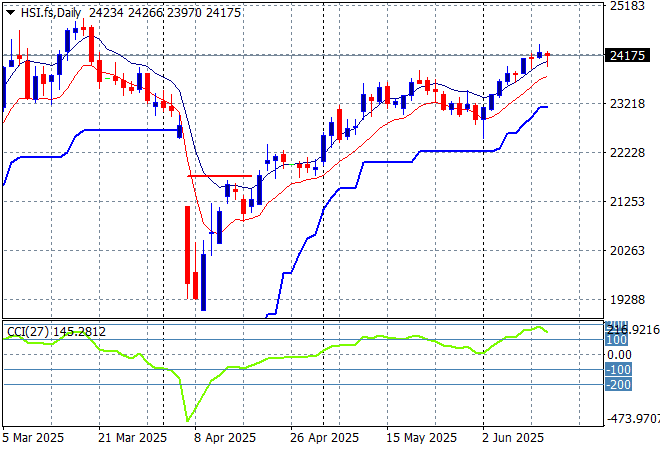
Looking at stock markets from Asia from yesterday’s session, where Chinese share markets are getting of their recent holding pattern as the Shanghai Composite holds above the 3400 point level while the Hang Seng Index has taken back its previous gains to be down nearly 1.3% to close just above the 24000 point level.
The daily chart shows a near complete fill of the March/April selloff although momentum is now picking up again and remains slightly overbought as the 90 day “relief” continues without any further positive news. Watch for any crack below the low moving average or 23000 point level but this looks a good breakout:
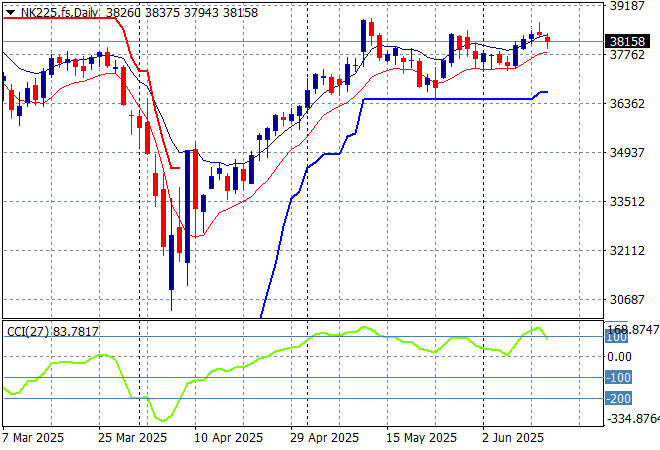
Japanese stock markets are failing to continue their bounce back with the Nikkei 225 moving 0.6% lower to 38181 points.
Daily price action was looking very keen indeed although daily momentum has slowed down somewhat this week after clearing resistance at the 36000 point level with another equity market that looks stretched and ready to rollover again here. Watch ATR support closely which appears to be firming in recent sessions:
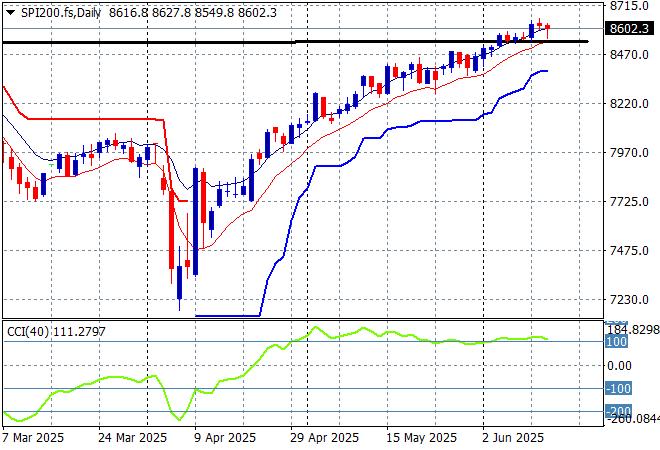
Australian stocks were the best relative performers with the ASX200 closing some 0.3% lower at 8565 points.
SPI futures are up a strong 0.5% or so but this could be fleeting despite the rise on Wall Street overnight. The daily chart pattern is still suggesting further upside is still possible as the inverted head and shoulders pattern is nearly complete with the RBA cut helping boost this but correlation with other risk markets will come into play here – watch as daily momentum is firming again:
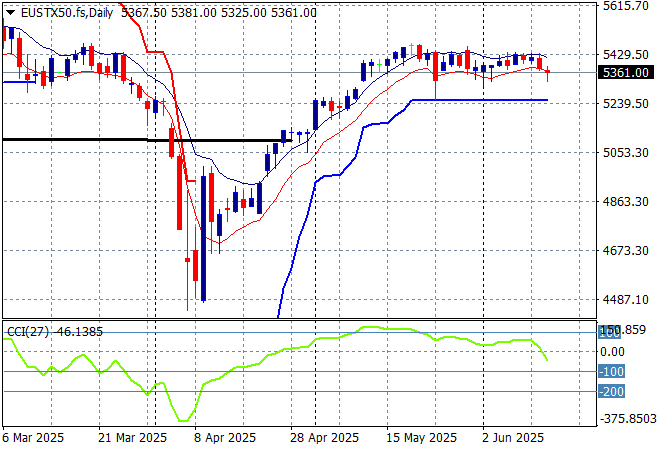
European markets still can’t find any positive momentum and fell back again with the Eurostoxx 50 Index slipping 0.6% lower to close at 5360 points.
Support at the previous monthly support levels (black line) at 5100 points is now firmly held with the bounce off the 2024 lows at the 4400 point level indicating a massive fill of this dump and pump action with the former February highs nearly complete. A rollover could still be forming here so watch for support at the 5200 point level proper:
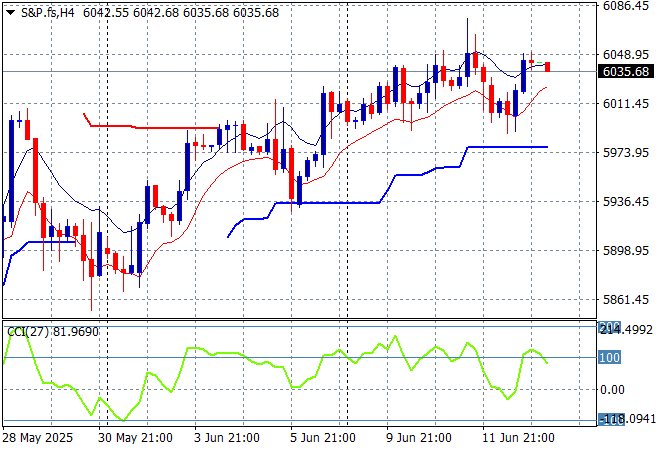
Wall Street seems like its caught in a trap as well but still managed some positivity in the cash session at least with the NASDAQ closing 0.3% higher while the S&P500 did even better, lifting 0.4% to close at 6045 points.
The four hourly chart was previously supporting a potential slowdown action here that could be translating to a top on the daily chart as prices try to get back above the pre-Trump Tariff Tax day. Hopium is still giving a lot of support to rising prices above the 6000 point level:
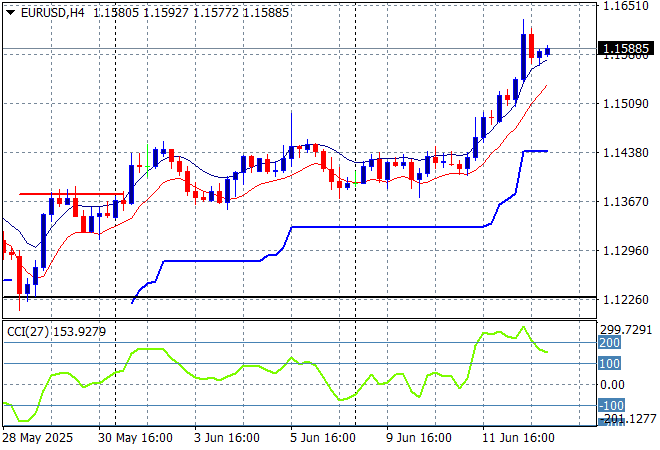
Currency markets are again moving against USD but this time in united fashion with King Dollar losing ground against Euro and Pound Sterling in particular, with the latter putting in an new yearly high.
The union currency is building strength continuously as bad domestic economic news from the US overshadows any continental slowdown with a swift rise above the 1.16 level on the latest weak PPI print and strong jobless claims. Medium term momentum remains very positive here albeit a bit overbought:
The USDJPY pair could not make its recent rebound stick and was sold off overnight to retreat below the 144 level after looking to get above that zone again as short term momentum reverts to negative settings.
I still contend we need to watch for any sustained break below the 139 level which completes a multi year bearish head and shoulders setup that could see the 110 to 120 level revisited. So despite this short term move on a potential trade deal, I’m still watching short term support that could come under pressure here again:

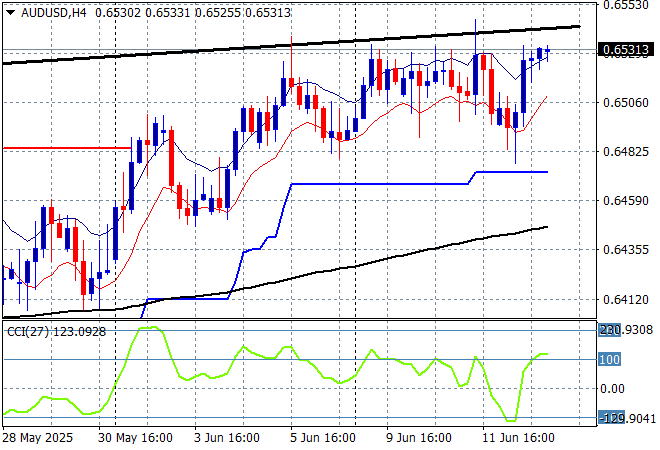
The Australian dollar is just pushing higher with a lot of internal support on the short and medium term charts with another breakout above the 65 cent level overnight after a mild pullback following Friday night’s NFP print, now exceeding the previous weekly highs.
Stepping back for a longer point of view (and looking at the trusty AUDNZD weekly cross) price action has remained supported by the 200 day MA (moving black line) after bouncing off a near new five year low. Keep an eye on temporary support at the 63 cent level but this is still looking promising for the Pacific Peso:
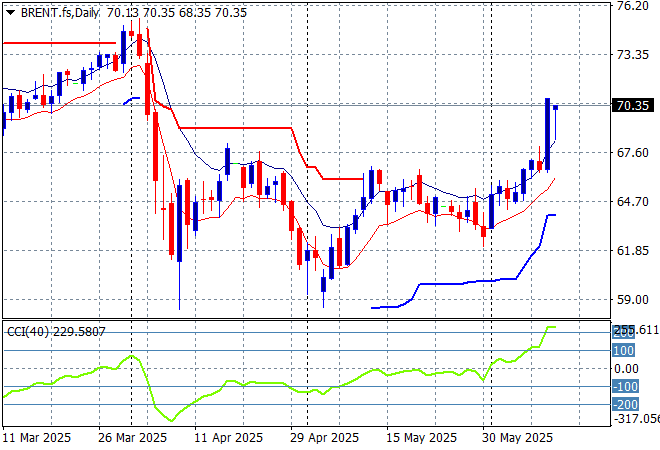
Oil markets had been building stronger following a positive reaction to Friday’s NFP report but escalating US tensions with Iran kept Brent crude well above the $70USD per barrel level overnight to extend its new monthly high.
The daily chart pattern shows the post New Year rally that got a little out of hand and now reverting back to the sideways lower action for the latter half of 2024. The potential for a return to the 2024 lows is still building here as domestic demand in the US is likely to continue to decline as the Trump Taxes take effect but watch for any breakout above the $66-67 zone:
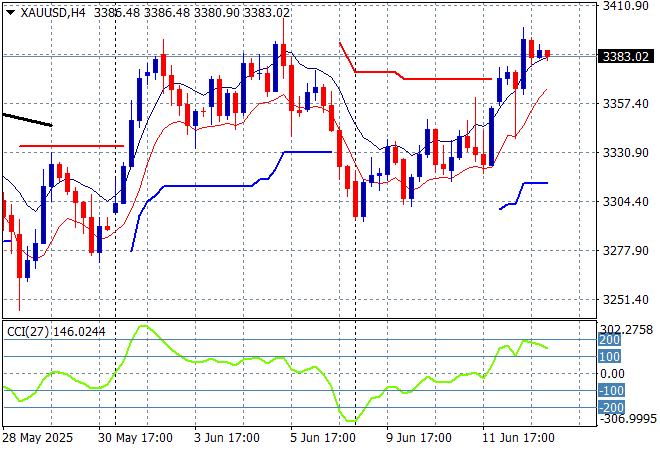
Gold was moving like the other undollars against USD after finding some stability last week but suffered the most on Friday night with a steep fall back to the low $3300USD per ounce level but has managed to get back on track to close above the $3380 level this morning.
Short term support had firmed immensely in recent sessions showing real strength but momentum became considerably overbought so this was inevitable as price action has reverted back to the uptrend line from the April lows. However it seems to want to climb above the recent weekly/monthly highs and have another crack at the $3400 level as USD weakens:
Glossary of Acronyms and Technical Analysis Terms:
ATR: Average True Range – measures the degree of price volatility averaged over a time period
ATR Support/Resistance: a ratcheting mechanism that follows price below/above a trend, that if breached shows above average volatility
CCI: Commodity Channel Index: a momentum reading that calculates current price away from the statistical mean or “typical” price to indicate overbought (far above the mean) or oversold (far below the mean)
Low/High Moving Average: rolling mean of prices in this case, the low and high for the day/hour which creates a band around the actual price movement
FOMC: Federal Open Market Committee, monthly meeting of Federal Reserve regarding monetary policy (setting interest rates)
DOE: US Department of Energy
Uncle Point: or stop loss point, a level at which you’ve clearly been wrong on your position, so cry uncle and get out/wrong on your position, so cry uncle and get out!