The first session following the release of the latest monthly US jobs print is usually benign and that’s what we had across most risk markets overnight as speculation about what the Federal Reserve will do until the next NFP print calmed down, sending the USD slightly lower against the majors. Uncertainty over trade deals kept Wall Street contained while European stocks slipped which should provide less momentum in the Asian session today. The Australian dollar remains strong as it stays above the 65 cent level again.
Oil prices have been building internal technical strength recently with WTI and Brent crude making new weekly highs while gold was able to bounce back a little from the overreaction on Friday night as it headed back above the $3300USD per ounce level.
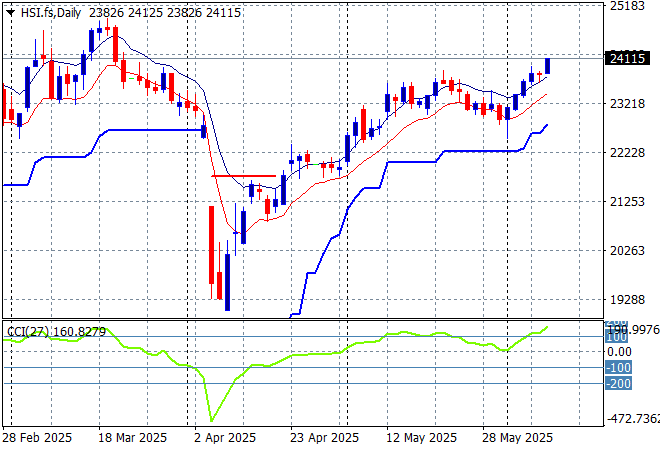
Looking at stock markets from Asia from yesterday’s session, where mainland Chinese share markets tried hard to get out of their recent holding pattern with the Shanghai Composite up slightly in the afternoon session but almost above the 3400 point level while the Hang Seng Index gained more than 1% to finally break the 24000 point level.
The daily chart shows a near complete fill of the March/April selloff although momentum is now picking up again and remains slightly overbought as the 90 day “relief” continues without any further positive news. Watch for any crack below the low moving average or 23000 point level but this looks a potential breakout:
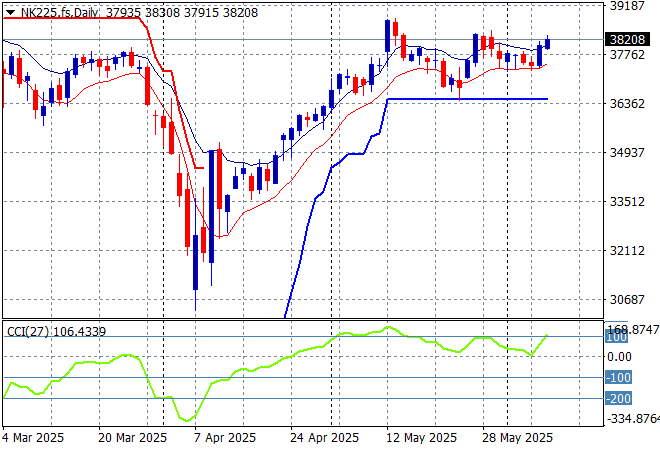
Japanese stock markets were also continuing their bounce back on the recently weaker Yen with the Nikkei 225 moving nearly 0.9% higher to 38078 points.
Daily price action was looking very keen indeed although daily momentum has slowed down somewhat this week after clearing resistance at the 36000 point level with another equity market that looks stretched and ready to rollover again here. Watch ATR support closely which appears to be firming in recent sessions:
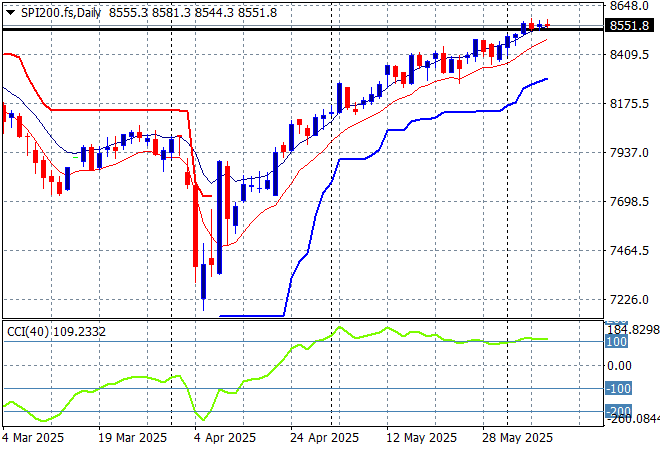
Australian stocks were closed for the long weekend.
SPI futures are flat, generally mirroring similar sessions on Wall Street from overnight. The daily chart pattern is still suggesting further upside is still possible as the inverted head and shoulders pattern is nearly complete with the RBA cut helping boost this but correlation with other risk markets will come into play here – watch as daily momentum is firming again:
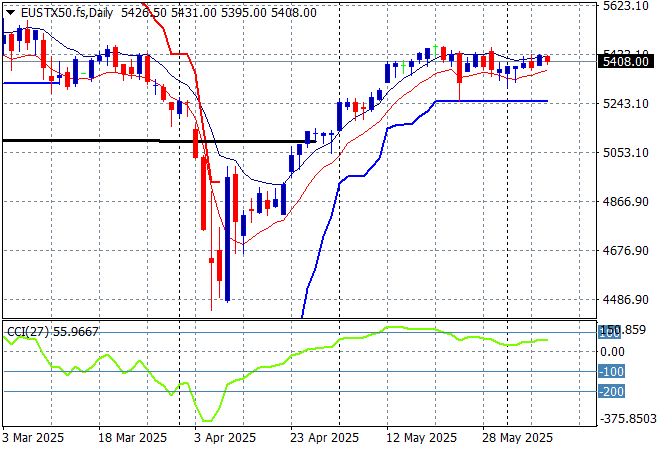
European markets slipped back again after recently managing only mild returns with the Eurostoxx 50 Index slipping nearly 0.2% lower to close at 5421 points.
Support at the previous monthly support levels (black line) at 5100 points is now firmly held with the bounce off the 2024 lows at the 4400 point level indicating a massive fill of this dump and pump action with the former February highs nearly complete. A rollover could still be forming here so watch for support at the 5200 point level proper:
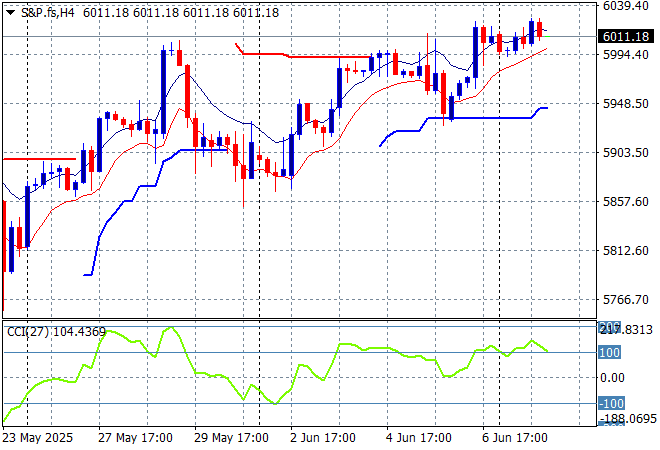
Wall Street was flat to very mildly positive with only the NASDAQ really putting runs on the board to close some 0.3% higher while the S&P500 finished up 0.1% at 6005 points.
The four hourly chart was previously supporting a potential slowdown action here that could be translating to a top on the daily chart as prices try to get back above the pre-Trump Tariff Tax day. This was again looking like a TACO trade as resistance seemed weak overhead although the potential for trade deals and hopium are still giving a lot of support to rising prices above the 6000 point level:
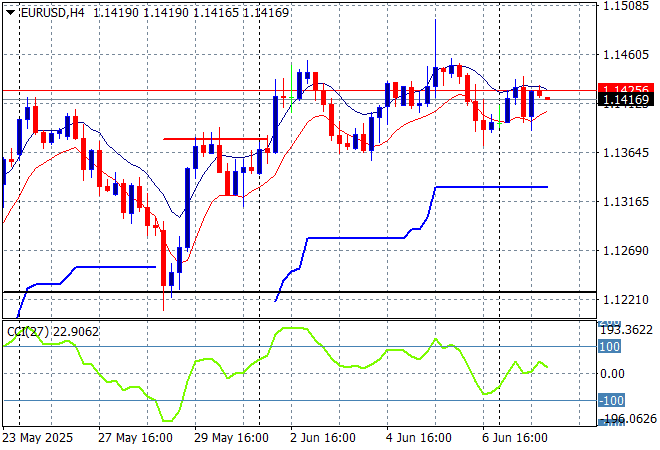
Currency markets remain largely on trend against King Dollar amid the tariff/X/trade deal/US budget bill chaos with just a small reprieve after the NFP print mainly due to a repricing in the Fed funds rate. Euro firmed again at the 1.14 level overnight and looks moderately supported here in the short term although resistance continues to build at the 1.15 handle proper.
The union currency was pushed back below the 1.13 handle previously but support bounced back at the 2023 and 2024 highs with a breakout above trailing ATR resistance on the four hourly chart still underway. Medium term momentum remains very positive here but watch for a potential pullback to the mid 1.13 level again:
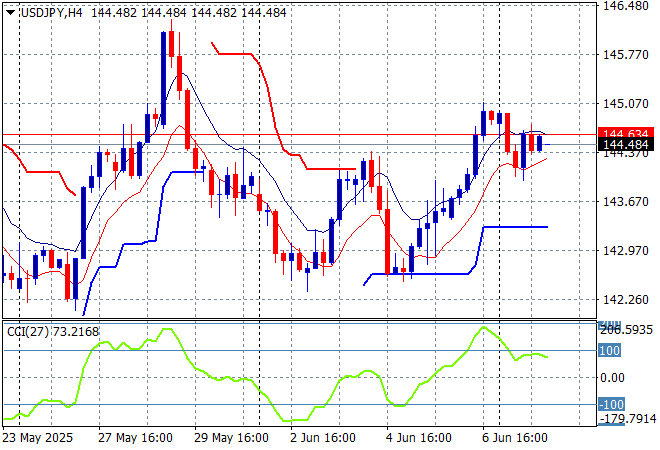
The USDJPY pair pushed its rebound higher again on Friday night to make a new weekly high just below the 145 level but failed to hold on to those gains following the weekend gap and sessions overnight, settling at the mid 144 level instead.
I still contend we need to watch for any sustained break below the 139 level which completes a multi year bearish head and shoulders setup that could see the 110 to 120 level revisited. So despite this short term move on a potential trade deal, I’m still watching short term support that could come under pressure here again:
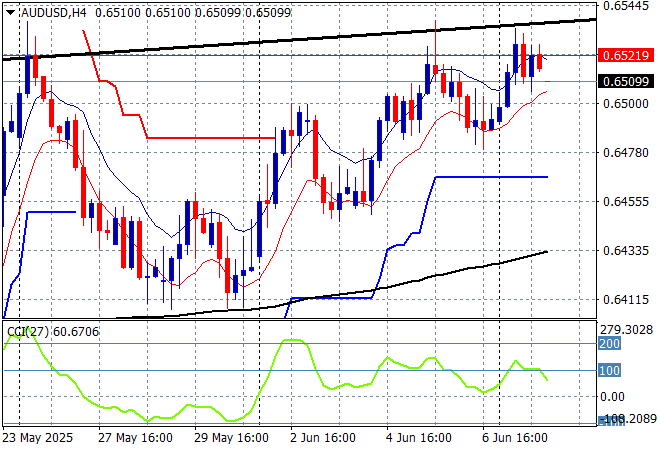
The Australian dollar just can’t be pushed down on USD resurgence as it again blasted through the 65 cent level overnight after a mild pullback following Friday night’s NFP print, matching the previous weekly highs.
Stepping back for a longer point of view (and looking at the trusty AUDNZD weekly cross) price action has remained supported by the 200 day MA (moving black line) after bouncing off a near new five year low. Keep an eye on temporary support at the 63 cent level but this is still looking promising for the Pacific Peso:
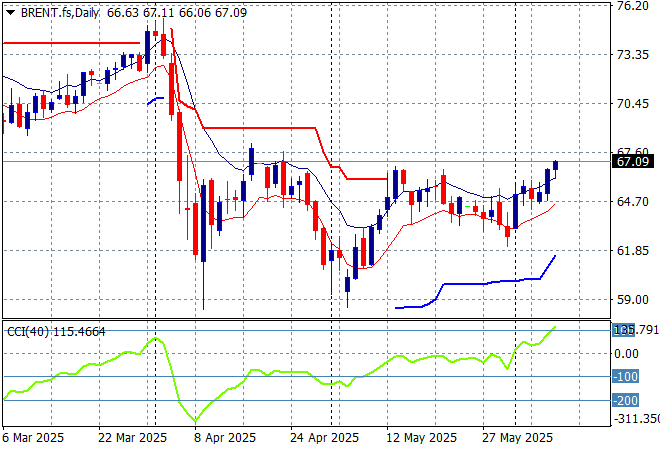
Oil markets are now building stronger following a positive reaction to Friday’s NFP report with Brent crude mow pushing above the $67USD per barrel level to make a new monthly high.
The daily chart pattern shows the post New Year rally that got a little out of hand and now reverting back to the sideways lower action for the latter half of 2024. The potential for a return to the 2024 lows is still building here as domestic demand in the US is likely to continue to decline as the Trump Taxes take effect but watch for any breakout above the $66-67 zone:
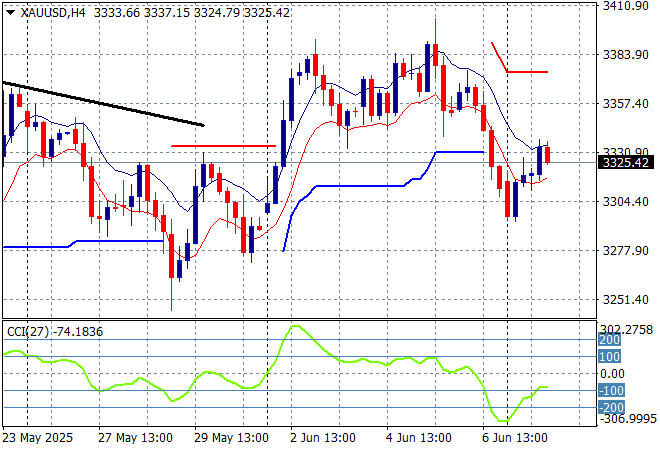
Gold was moving like the other undollars against USD after finding some stability last week but suffered the most on Friday night with a steep fall back to the low $3300USD per ounce level but managed a small reversal over the weekend gap to close at the $3320 level this morning.
Short term support had firmed immensely in recent sessions showing real strength but momentum became considerably overbought so this was inevitable as price action has reverted back to the uptrend line from the April lows. This line had appeared broken but could be a false positive on temporary USD strength?
Glossary of Acronyms and Technical Analysis Terms:
ATR: Average True Range – measures the degree of price volatility averaged over a time period
ATR Support/Resistance: a ratcheting mechanism that follows price below/above a trend, that if breached shows above average volatility
CCI: Commodity Channel Index: a momentum reading that calculates current price away from the statistical mean or “typical” price to indicate overbought (far above the mean) or oversold (far below the mean)
Low/High Moving Average: rolling mean of prices in this case, the low and high for the day/hour which creates a band around the actual price movement
FOMC: Federal Open Market Committee, monthly meeting of Federal Reserve regarding monetary policy (setting interest rates)
DOE: US Department of Energy
Uncle Point: or stop loss point, a level at which you’ve clearly been wrong on your position, so cry uncle and get out/wrong on your position, so cry uncle and get out!