
Last night saw the release of the latest US ISM services and private jobs data reports and both slumped below market expectations, halting the mini rally on Wall Street and tanking the USD once again. More talk but no resulting trade deals couldn’t lift King Dollar as the Trump regime patiently waits for the, let me check my notes, “the rest of the world” to get back to them by yesterday….Meanwhile the Bank of Canada held fire on more interest rate cuts despite the Canadian domestic economy feeling the pinch while its seems the ECB may also be doing the same. US Treasury yields pulled back slightly while most undollars advanced, including the Australian dollar which was pushed back up towards the 65 cent level.
Oil prices are trying to maintain recent strength with Brent crude now holding around but not advancing past the $65USD per barrel level while gold was able to make further gains on its Friday fightback as it lifted above the $3370USD per ounce level overnight.
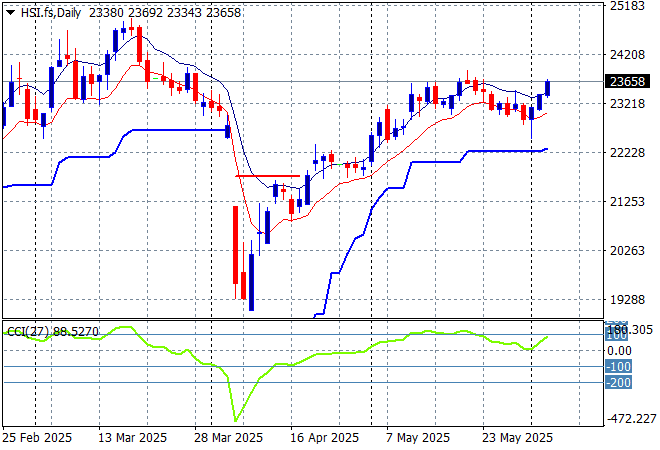
Looking at stock markets from Asia from yesterday’s session, where mainland Chinese share markets continued to have solid gains with the Shanghai Composite lifting 0.4% while the Hang Seng Index put only nearly 0.6% to build above the 23000 point level.
The daily chart shows a near complete fill of the March/April selloff although momentum is now picking up again and remains slightly overbought as the 90 day “relief” continues without any further positive news. Watch for any crack below the low moving average or 23000 point level:
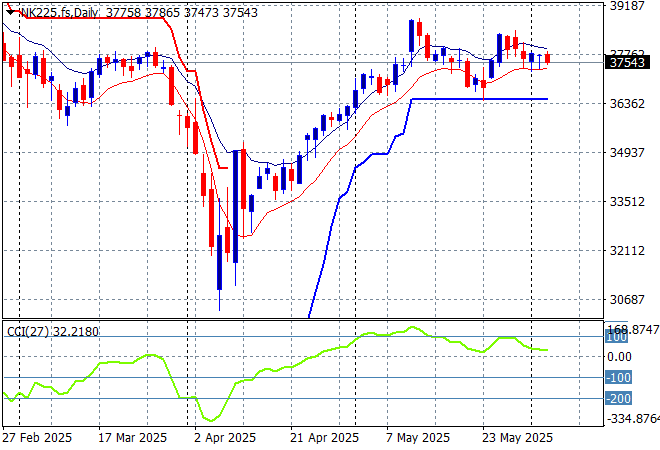
Japanese stock markets were the strongest in the region on the weaker Yen with the Nikkei 225 moving nearly 1% higher to 37806 points.
Daily price action was looking very keen indeed although daily momentum has slowed down somewhat this week after clearing resistance at the 36000 point level with another equity market that looks stretched and ready to rollover again here. Watch ATR support closely which appears to be firming in recent sessions:
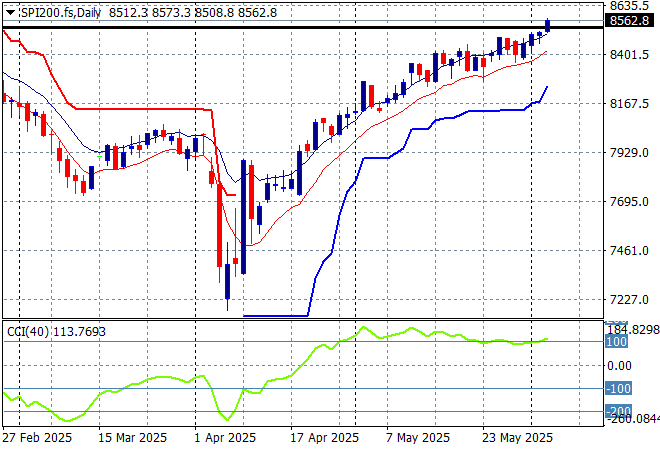
Australian stocks were able to put on some very strong gains despite the slowing GDP print with the ASX200 closing 0.9% higher at 8541 points.
SPI futures are flat however reflecting the mixed session on Wall Street overnight. The daily chart pattern is still suggesting further upside is still possible as the inverted head and shoulders pattern is nearly complete with the RBA cut helping boost this but correlation with other risk markets will come into play here – watch as daily momentum is firming again:
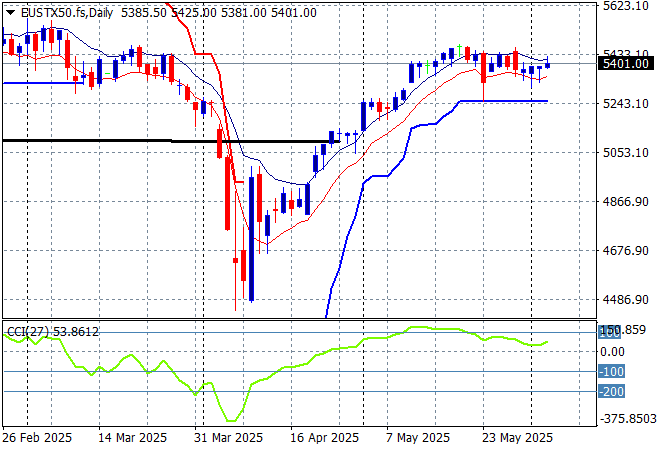
European markets continued their rebounds with solid moves across the continent as the Eurostoxx 50 Index finished nearly 0.5% higher at 5405 points.
Support at the previous monthly support levels (black line) at 5100 points is now firmly held with the bounce off the 2024 lows at the 4400 point level indicating a massive fill of this dump and pump action with the former February highs nearly complete. A rollover could be forming here so watch for support at the 5200 point level proper:
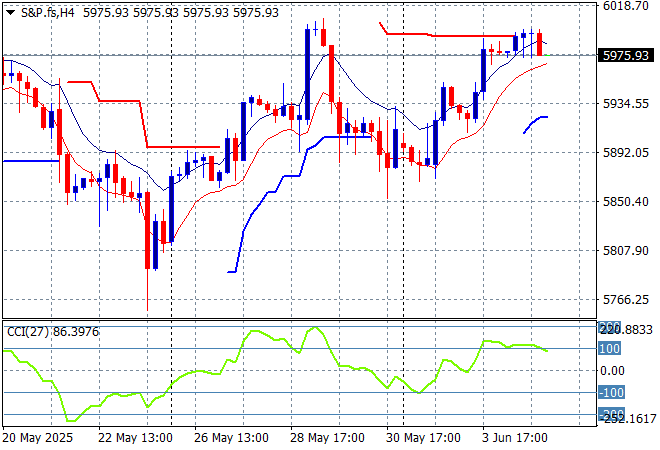
Wall Street had a mixed session with only the NASDAQ really advancing, lifting some 0.3% higher while the S&P500 finished dead flat at 5970 points.
The four hourly chart was previously supporting a potential slowdown action here that could be translating to a top on the daily chart as prices try to get back above the pre-Trump Tariff Tax day. This is again looking like a TACO trade as resistance seems weak overhead although macro releases like the ISM last night could stall this recovery:
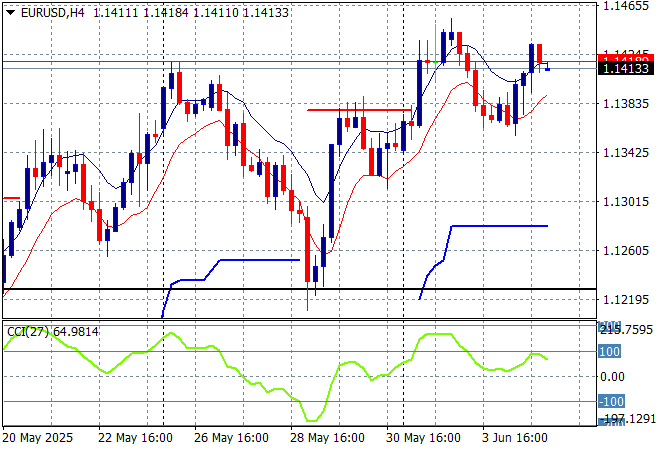
Currency markets are getting back on trend against King Dollar amid the tariff chaos but also as the domestic US economic data continues to sour with a further pushback from most of the undollars overnight, as Euro was pushed back above the 1.14 level to try to get back to its recent new weekly high.
The union currency was pushed back below the 1.13 handle previously but support bounced back at the 2023 and 2024 highs with a breakout above trailing ATR resistance on the four hourly chart. Medium term momentum remains very positive here so watch for a potential breakout above the mid 1.14 level for a new high:
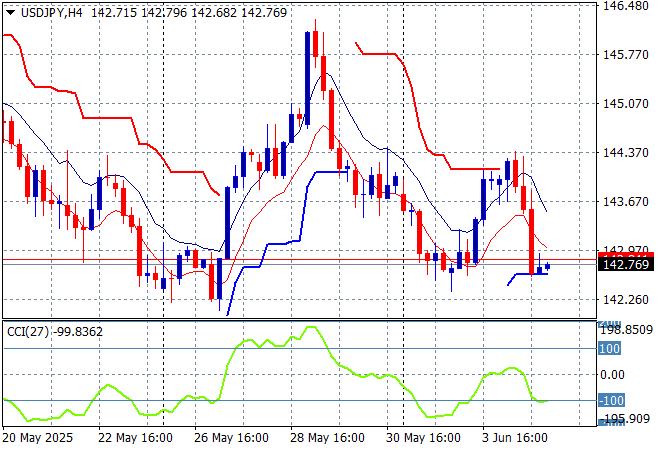
The USDJPY pair had a significant rebound in the Asian session previously on BOJ comments but this was swiftly reversed overnight as USD weakness took over with a near 200 pip slump back below the 143 level as a result.
I still contend we need to watch for any sustained break below the 139 level which completes a multi year bearish head and shoulders setup that could see the 110 to 120 level revisited. Watch the short term support that could come under pressure here first:
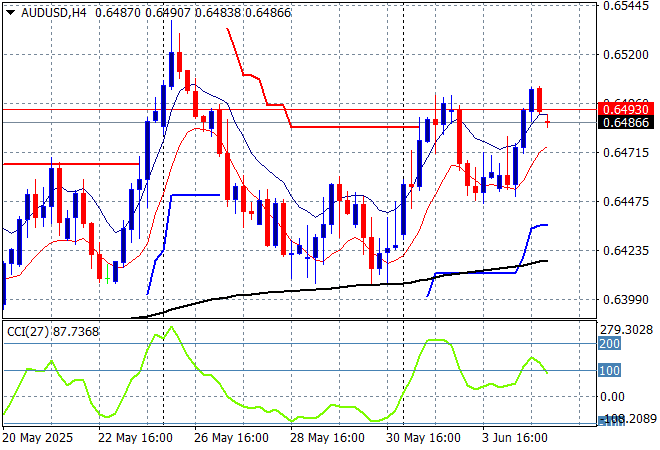
The Australian dollar had been pushed down on USD resurgence after blasting through the 65 cent level previously but was able to dust itself off again with a new high for the week overnight before settling just below that key level this morning.
Stepping back for a longer point of view (and looking at the trusty AUDNZD weekly cross) price action has remained supported by the 200 day MA (moving black line) after bouncing off a near new five year low. Keep an eye on temporary support at the 63 cent level but this is looking promising for the Pacific Peso:
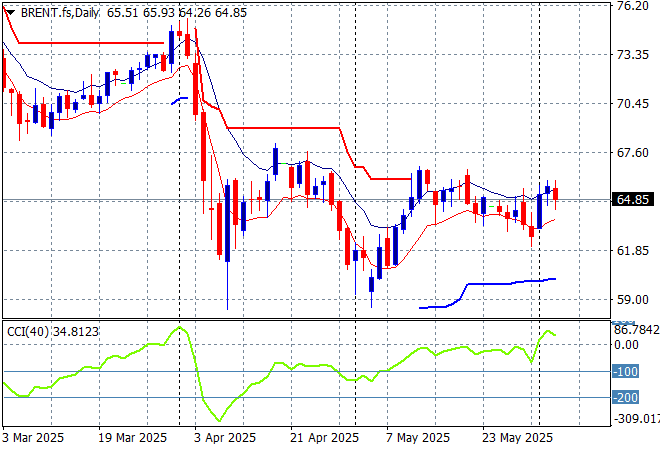
Oil markets are still trying hard to get back on track with more took of the Saudis goosing OPEC with further production boosts keeping sentiment contained as Brent crude was pushed slightly below the $65USD per barrel level overnight.
The daily chart pattern shows the post New Year rally that got a little out of hand and now reverting back to the sideways lower action for the latter half of 2024. The potential for a return to the 2024 lows is still building here as domestic demand in the US is likely to continue to decline as the Trump Taxes take effect but watch for any breakout above the $66-67 zone:
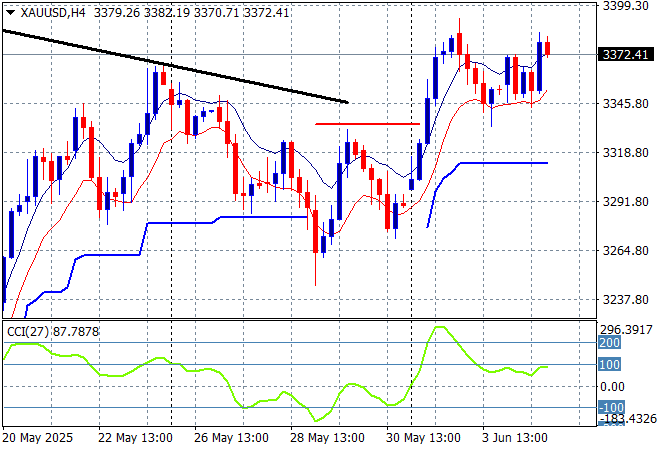
Gold is moving like the other undollars against USD and after finding some stability on Friday night, has managed a strong return above the $3350USD per ounce level with another attempt overnight to get above the $3400 level.
Short term support had firmed immensely in recent sessions showing real strength but momentum became considerably overbought so this was inevitable as price action has reverted back to the uptrend line from the April lows. This line appears broken and we could be seeing a more sustained breakout building on USD weakness:
Glossary of Acronyms and Technical Analysis Terms:
ATR: Average True Range – measures the degree of price volatility averaged over a time period
ATR Support/Resistance: a ratcheting mechanism that follows price below/above a trend, that if breached shows above average volatility
CCI: Commodity Channel Index: a momentum reading that calculates current price away from the statistical mean or “typical” price to indicate overbought (far above the mean) or oversold (far below the mean)
Low/High Moving Average: rolling mean of prices in this case, the low and high for the day/hour which creates a band around the actual price movement
FOMC: Federal Open Market Committee, monthly meeting of Federal Reserve regarding monetary policy (setting interest rates)
DOE: US Department of Energy
Uncle Point: or stop loss point, a level at which you’ve clearly been wrong on your position, so cry uncle and get out/wrong on your position, so cry uncle and get out!