
Last night saw the release of the latest EU flash inflation figures which imply some building deflationary pressures while the latest US factory orders blew up to a new low, reinforcing the damage done by the Trump regime’s tariff “plan”. But reality didn’t matter to equity markets as they reacted to speculation around potential trade deals and the potential pushback against the Trump’s Terrifically Terrible Tax bill in the US Senate. The USD came back across the board due to positive comments around a potential China-US trade deal with the Australian dollar pushed back to the mid 64 cent level.
Oil prices have regained some strength with Brent crude now holding above the $65USD per barrel level while gold was unable to make further gains on its Friday fightback as it retraced back to the $3350USD per ounce level overnight.
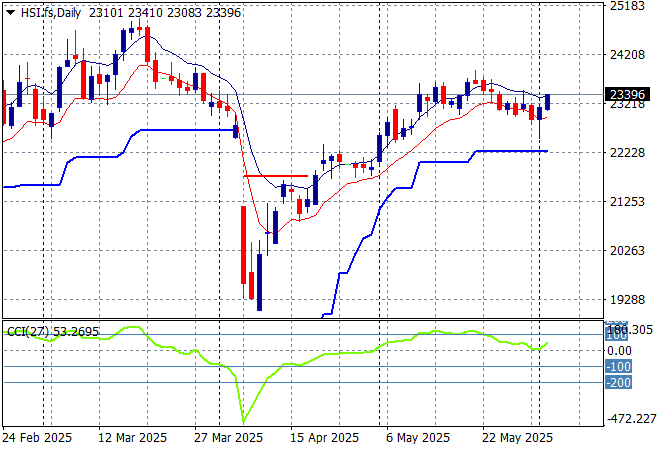
Looking at stock markets from Asia from yesterday’s session, where mainland Chinese share markets returned from their long weekend with the Shanghai Composite lifting 0.4% while the Hang Seng Index has jumped some 1.5% to get back above the 23000 point level.
The daily chart shows a near complete fill of the March/April selloff although momentum is now picking up again and remains slightly overbought as the 90 day “relief” continues without any further positive news. Watch for any crack below the low moving average or 23000 point level:
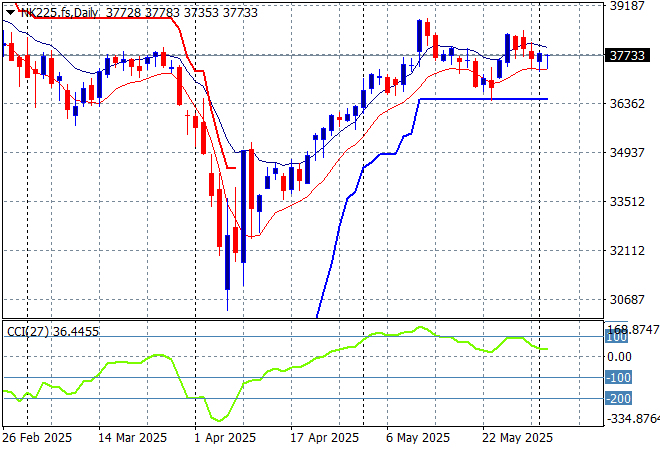
Japanese stock markets were on the backfoot due to BOJ talk with the Nikkei 225 barely making headway to close at 37446 points.
Daily price action was looking very keen indeed although daily momentum has slowed down somewhat this week after clearing resistance at the 36000 point level with another equity market that looks stretched and ready to rollover again here. Watch ATR support closely which appears to be firming in recent sessions:
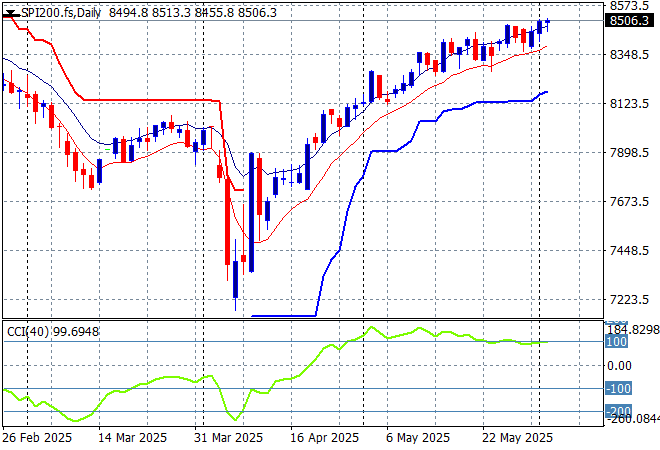
Australian stocks were able to put on some steady gains against the RBA minutes backdrop with the ASX200 closing 0.6% higher at 8466 points
SPI futures are up nearly 0.3% on the strong result on Wall Street overnight. The daily chart pattern is still suggesting further upside is still possible as the inverted head and shoulders pattern is nearly complete with the RBA cut helping boost this but correlation with other risk markets will come into play here – watch as daily momentum is firming again:
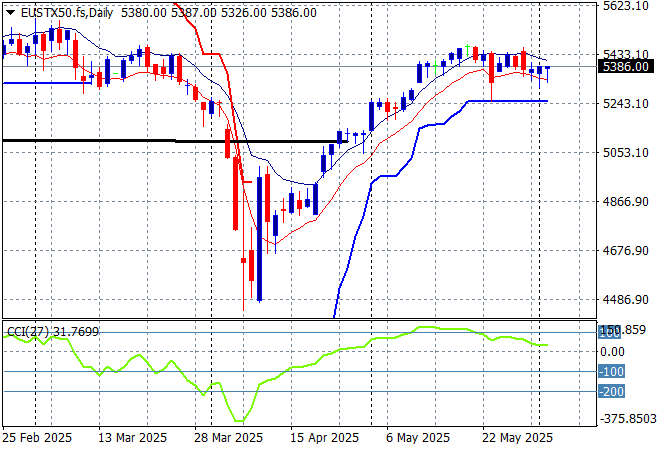
European markets were finally able to continue their rebounds with strong moves across the continent as the Eurostoxx 50 Index finished nearly 0.4% higher at 5375 points.
Support at the previous monthly support levels (black line) at 5100 points is now firmly held with the bounce off the 2024 lows at the 4400 point level indicating a massive fill of this dump and pump action with the former February highs nearly complete. A rollover could be forming here so watch for support at the 5200 point level proper:
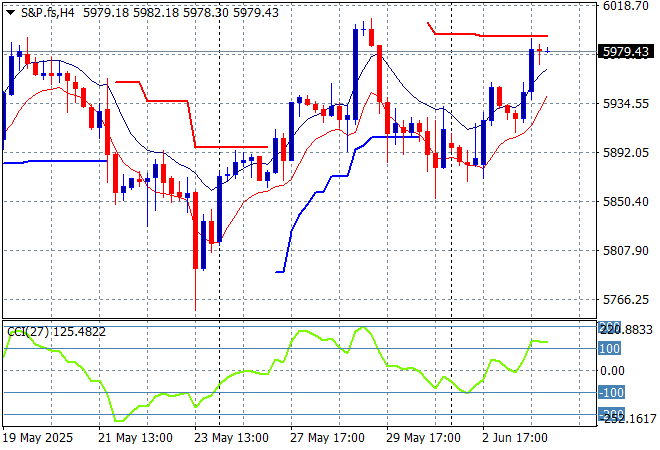
Wall Street had another robust session with gains across the board as the NASDAQ lifted more than 0.8% higher while the S&P500 finished up nearly 0.6% to close at 5970 points.
The four hourly chart was previously supporting a potential slowdown action here that could be translating to a top on the daily chart as prices try to get back above the pre-Trump Tariff Tax day. This is again looking like a TACO trade as resistance seems weak overhead:
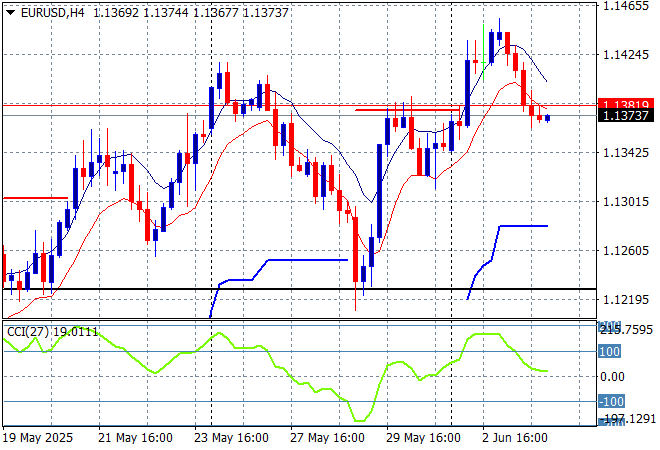
Currency markets had been moving against King Dollar amid the tariff chaos but saw some pushback across all the undollars overnight, Yen particularly on overshoot but Euro also was pushed back below the 1.14 level after recently making a new weekly high.
The union currency was pushed back below the 1.13 handle previously but support bounced back at the 2023 and 2024 highs with a breakout above trailing ATR resistance on the four hourly chart. Medium term momentum remains very positive here despite last night’s retracement:
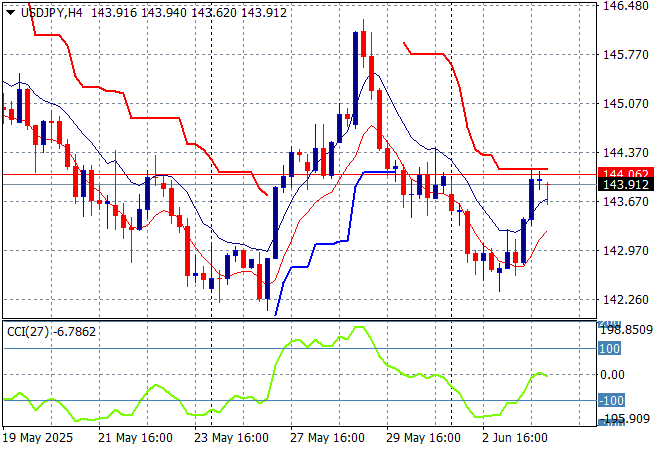
The USDJPY pair had a significant rebound in the Asian session yesterday on BOJ comments and was able to hold on and then extend those gains when some Fed members overnight indicated they are looking through July before making any rate cuts. The pair jumped a full handle up to the 144 level as a result.
I still contend we need to watch for any sustained break below the 139 level which completes a multi year bearish head and shoulders setup that could see the 110 to 120 level revisited. Watch the short term support that could come under pressure here first:
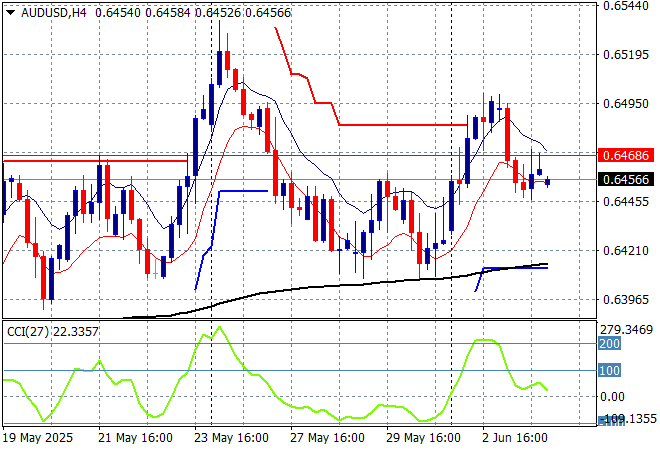
The Australian dollar had been pushed down on USD resurgence after blasting through the 65 cent level previously and has suffered a similar fate again, falling back to the mid 64 cent level overnight.
Stepping back for a longer point of view (and looking at the trusty AUDNZD weekly cross) price action has remained supported by the 200 day MA (moving black line) after bouncing off a near new five year low. Keep an eye on temporary support at the 63 cent level and watch today’s GDP print carefully:
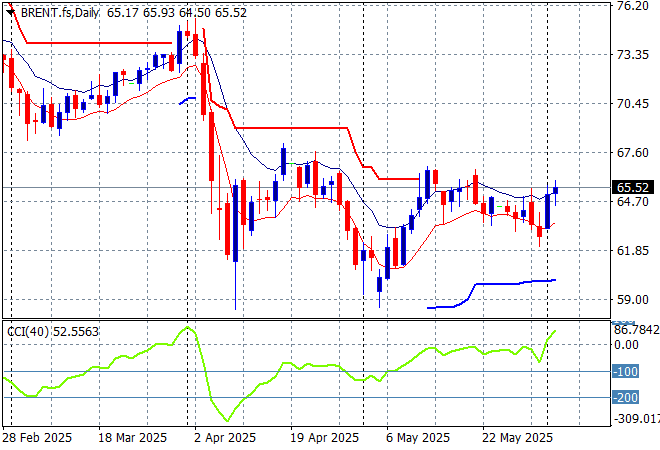
Oil markets are still trying hard to get back on track and the latest OPEC production boost should have seen a fall but instead prices remain elevated overnight with Brent crude staying above the $65USD per barrel level.
The daily chart pattern shows the post New Year rally that got a little out of hand and now reverting back to the sideways lower action for the latter half of 2024. The potential for a return to the 2024 lows is still building here as domestic demand in the US is likely to continue to decline as the Trump Taxes take effect but watch for any breakout above the $66-67 zone:
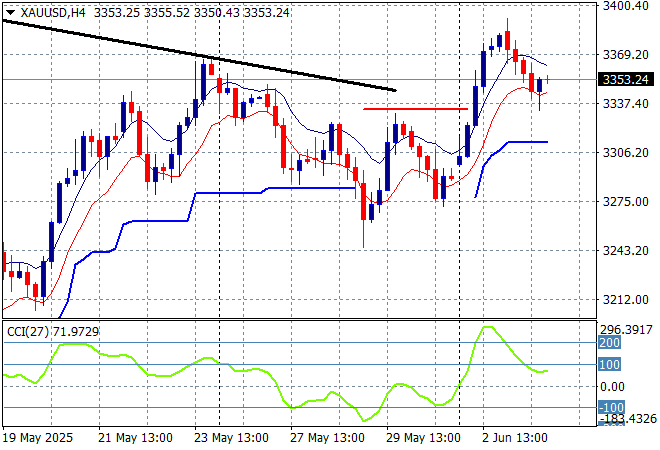
Gold had briefly retraced below the $3300USD per ounce level after deflating all week but managed like the other undollars to find some stability on Friday night, although it too had a small setback overnight to return to the $3350 level with strong internal support.
Short term support had firmed immensely in recent sessions showing real strength but momentum became considerably overbought so this was inevitable as price action has reverted back to the uptrend line from the April lows. This line appears broken and we could be seeing a more sustained breakout building on USD weakness:
Glossary of Acronyms and Technical Analysis Terms:
ATR: Average True Range – measures the degree of price volatility averaged over a time period
ATR Support/Resistance: a ratcheting mechanism that follows price below/above a trend, that if breached shows above average volatility
CCI: Commodity Channel Index: a momentum reading that calculates current price away from the statistical mean or “typical” price to indicate overbought (far above the mean) or oversold (far below the mean)
Low/High Moving Average: rolling mean of prices in this case, the low and high for the day/hour which creates a band around the actual price movement
FOMC: Federal Open Market Committee, monthly meeting of Federal Reserve regarding monetary policy (setting interest rates)
DOE: US Department of Energy
Uncle Point: or stop loss point, a level at which you’ve clearly been wrong on your position, so cry uncle and get out/wrong on your position, so cry uncle and get out!