
Friday night was a mixed one for risk markets and will be compounded again with a lot of weekend news, let alone the big strike on Russia by the Ukrainians, but also Chinese PMI prints and what looks like another round of tariffs from the Trump regime coupled with a lot of whining about China. Again. Meanwhile the flipflop on tariffs saw the recently resurgent USD continue to lose ground against the major currency pairs while Treasury yields actually contracted slightly across the yield curve. The Australian dollar was one of the weaker undollars but is managing to stay around the 64 cent level against USD.
Oil prices remain somewhat weak with Brent crude unable to get back above the $64USD per barrel level as OPEC starts to push for higher production while gold was able to climb back above the $3300USD per ounce level but remains under pressure.
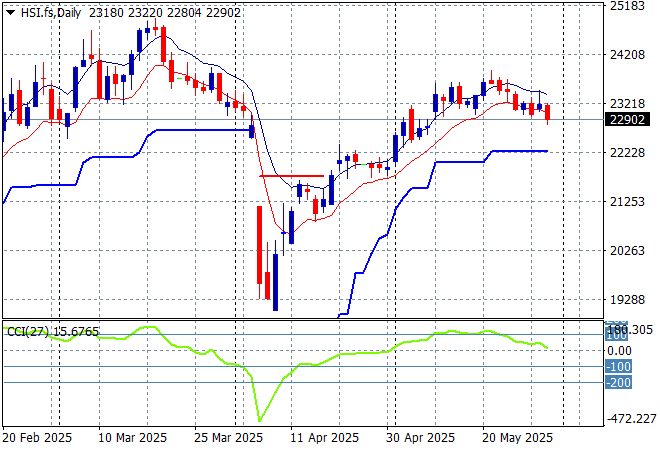
Looking at stock markets from Asia from Friday’s session, where mainland Chinese share markets pulled back in the afternoon session with the Shanghai Composite down 0.5% to 3347 points while the Hang Seng Index has slumped some 1.2% to almost break below the 23000 point level.
The daily chart shows a near complete fill of the March/April selloff although momentum is now picking up again and remains slightly overbought as the 90 day “relief” continues without any further positive news. Watch for any crack below the low moving average or 23000 point level:
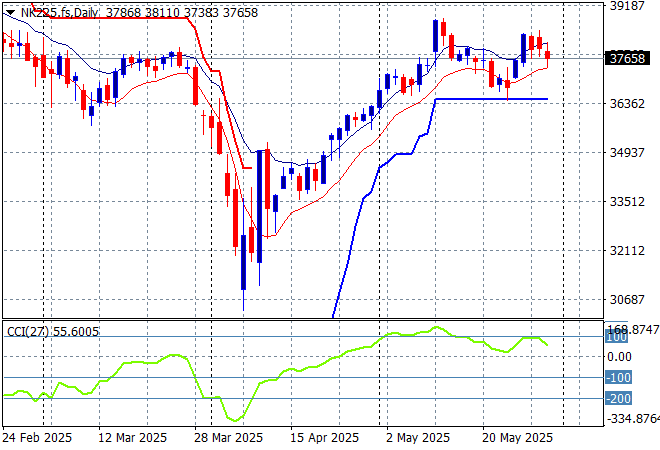
Japanese stock markets were also on the backfoot with the Nikkei 225 down 1.2% to 37965 points.
Daily price action was looking very keen indeed although daily momentum has slowed down somewhat this week after clearing resistance at the 36000 point level with another equity market that looks stretched and ready to rollover again here. Watch ATR support closely which appears to be firming in recent sessions:
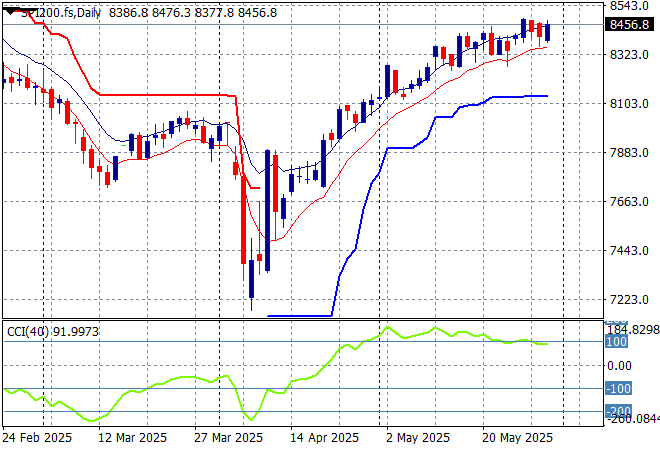
Australian stocks were the odd ones out and managed to eke out a small lift higher with the ASX200 closing 0.3% higher to 8432 points.
SPI futures are flat on the mixed result on Wall Street on Friday night. The daily chart pattern suggests further upside is still possible as the inverted head and shoulders pattern is nearly complete with the RBA cut helping boost this but correlation with other risk markets will come into play here – watch as daily momentum is firming again:
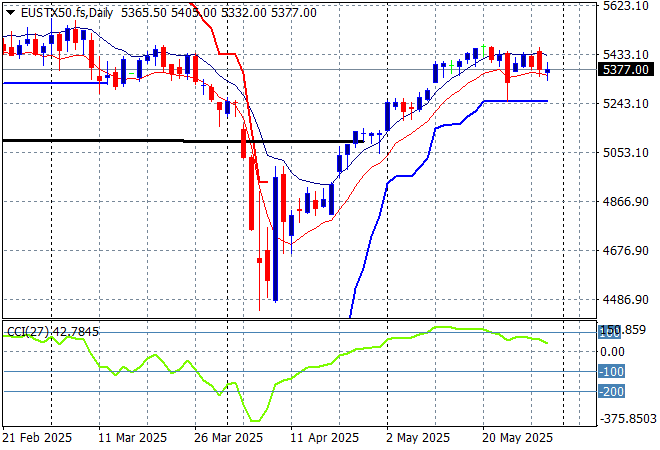
European markets failed to continue their rebounds even though the German DAX lifted slightly as the Eurostoxx 50 Index finished nearly 0.2% lower at 5366 points.
Support at the previous monthly support levels (black line) at 5100 points is now firmly held with the bounce off the 2024 lows at the 4400 point level indicating a massive fill of this dump and pump action with the former February highs nearly complete. A rollover could be forming here so watch for support at the 5200 point level proper:
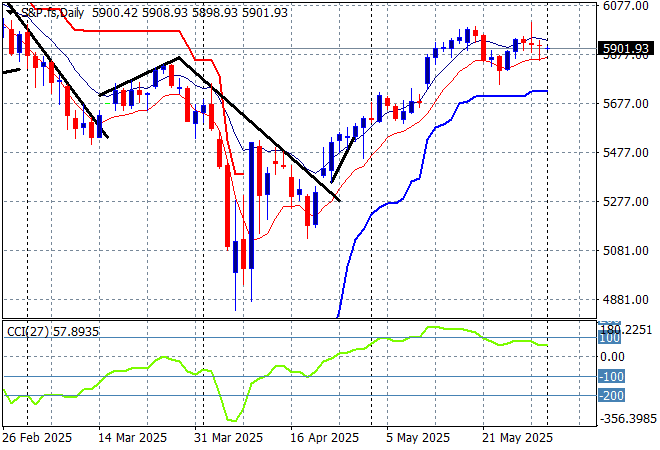
Wall Street had a strange session again with the headline Dow up while the NASDAQ lost nearly 0.4% while the S&P500 finished with a scratch session at 5912 points.
The four hourly chart was previously supporting a potential slowdown action here that could be translating to a top on the daily chart as prices gets back above the pre-Trump Tariff Tax day. But this is broadcasting indecision with yet another round of stupid tariffs coming down the pipeline this week set to build some resistance:
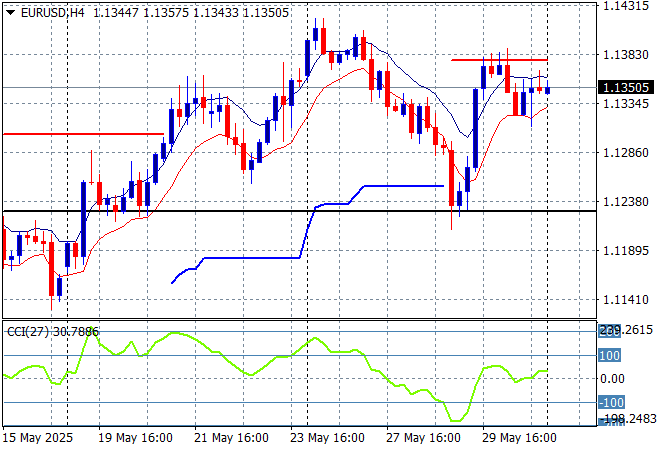
Currency markets had been moving back towards King Dollar strength despite the latest FOMC warnings but this was flipped again on the appeal on the Trump regime tariffs and some macro news out of Europe. Euro was pushed back above the 1.13 level after briefly breaking into the low 1.12 zone to almost get back to its previous weekly high.
The union currency was pushed back below the 1.13 handle previously but support bounced back at the 2023 and 2024 highs with a breakout above trailing ATR resistance on the four hourly chart. Medium term momentum remains quite positive here but watch for any break below last week’s low at the mid 1.12 level:
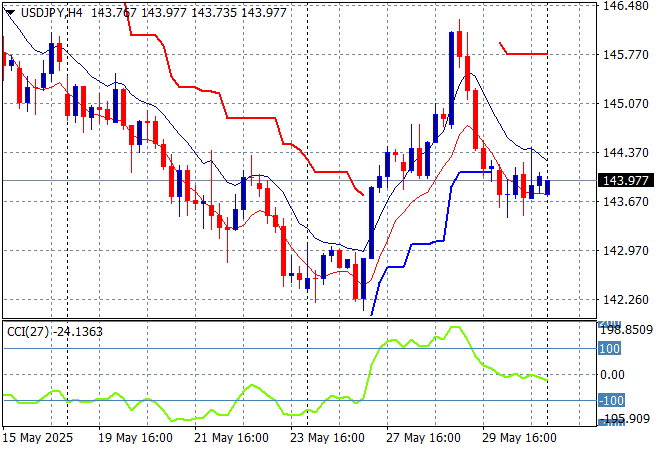
The USDJPY pair rebounded most of this week but then got way ahead of itself before a solid 200 pip retracement that saw it move back to the 144 handle and then slightly below that level on some stability on Friday night where its found some tentative support.
I still contend we need to watch for any sustained break below the 139 level which completes a multi year bearish head and shoulders setup that could see the 110 to 120 level revisited. Watch the short term support that could come under pressure here first:
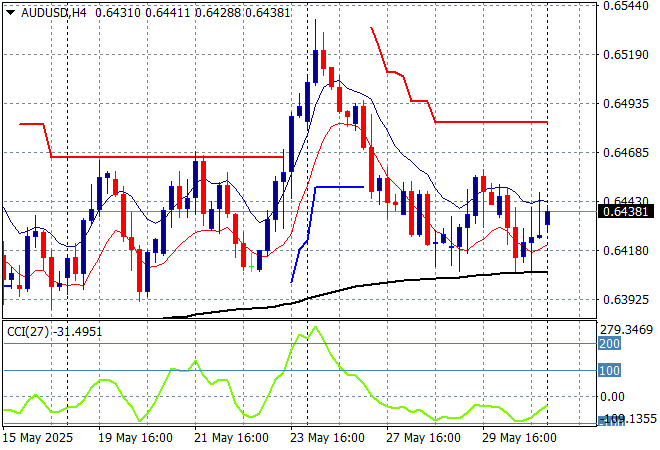
The Australian dollar had been pushed down on USD resurgence after blasting through the 65 cent level previously but managed a small reprieve on Friday night although still weighed down by short term resistance at the mid 64 cent level.
Stepping back for a longer point of view (and looking at the trusty AUDNZD weekly cross) price action has remained supported by the 200 day MA (moving black line) after bouncing off a near new five year low. Keep an eye on temporary support at the 63 cent level:
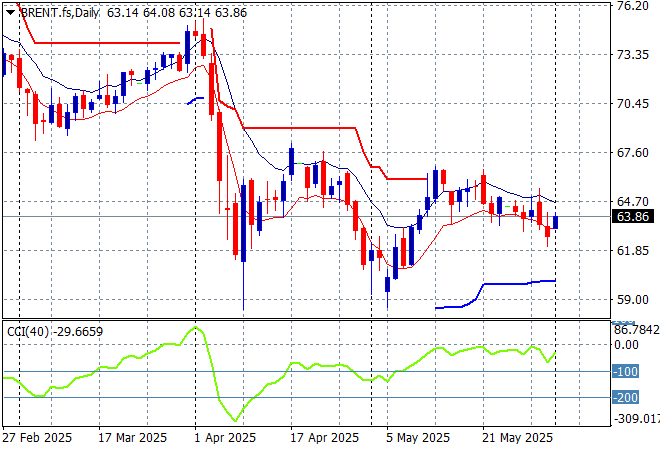
Oil markets are still trying hard but failing to hold onto the post tariff bounce with Brent crude pushed down below the $64USD per barrel level again after failing to make a new weekly high.
The daily chart pattern shows the post New Year rally that got a little out of hand and now reverting back to the sideways lower action for the latter half of 2024. The potential for a return to the 2024 lows is still building here as domestic demand in the US is likely to continue to decline as the Trump Taxes take effect and OPEC announce more production:
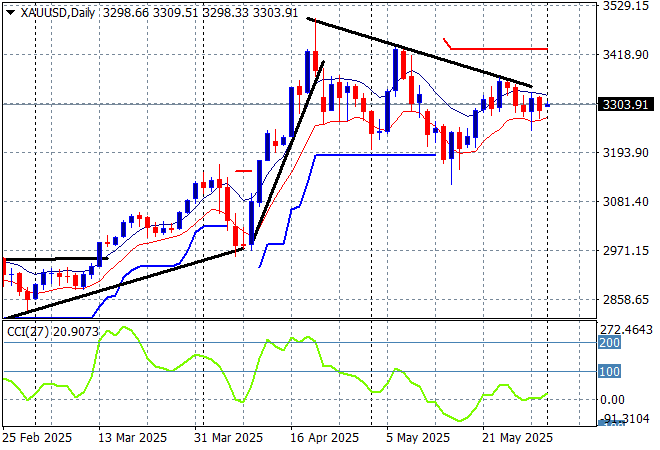
Gold had briefly retraced below the $3300USD per ounce level after deflating all week but managed like the other undollars to find some stability on Friday night, popping back above that level but only just.
Short term support had firmed immensely in recent sessions showing real strength but momentum became considerably overbought so this was inevitable as price action has reverted back to the uptrend line from the April lows. There is further support at the $3200 level that could be tested next on the overshoot:
Glossary of Acronyms and Technical Analysis Terms:
ATR: Average True Range – measures the degree of price volatility averaged over a time period
ATR Support/Resistance: a ratcheting mechanism that follows price below/above a trend, that if breached shows above average volatility
CCI: Commodity Channel Index: a momentum reading that calculates current price away from the statistical mean or “typical” price to indicate overbought (far above the mean) or oversold (far below the mean)
Low/High Moving Average: rolling mean of prices in this case, the low and high for the day/hour which creates a band around the actual price movement
FOMC: Federal Open Market Committee, monthly meeting of Federal Reserve regarding monetary policy (setting interest rates)
DOE: US Department of Energy
Uncle Point: or stop loss point, a level at which you’ve clearly been wrong on your position, so cry uncle and get out/wrong on your position, so cry uncle and get out!
