
Another late night tariff threat dump by a senile Trump on Friday upset risk markets across both sides of the Atlantic which will result in increased volatility on the open here in Asia. Following the passage of the Trump regime’s new “Tax” Deal (aka blowing out the deficit forever) this will also embolden volatility on bond markets with long dated Treasury bonds spiking in yields. This continued uncertainty is leading a broader selloff in USD with Pound Sterling making a new yearly high while Euro, Loonie and Yen all made new highs followed by the Aussie and Kiwi as they nearly matched their pre-rate cut highs.
Oil prices remain somewhat weak with Brent crude pushed around the $64USD per barrel level while gold and Bitcoin continue to see a bid with the shiny metal launched up to the $3350USD per ounce level on Friday night.
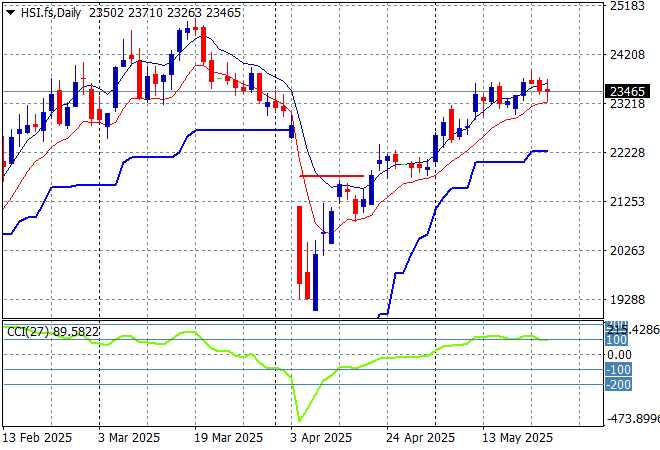
Looking at stock markets from Asia from Friday’s session, where mainland Chinese share markets fell sharply in the afternoon session with the Shanghai Composite down 0.8% while the Hang Seng Index was only able to tread water as it fails to push above the 24000 point level.
The daily chart shows a near complete fill of the March/April selloff although momentum is now picking up again and remains slightly overbought as the 90 day “relief” continues without any further positive news. Watch for any crack below the low moving average or 23000 point level:
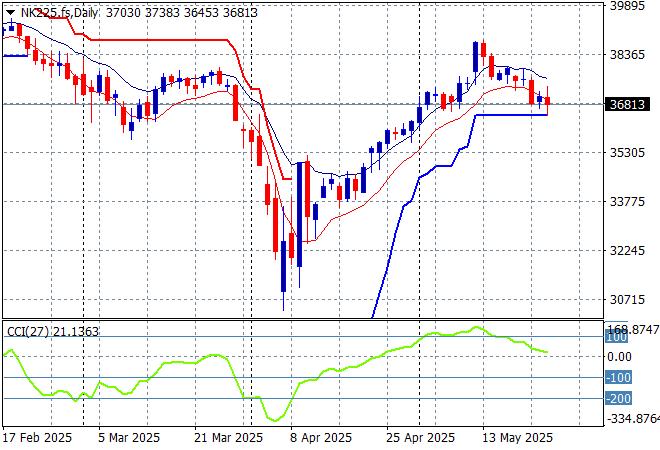
Japanese stock markets did a lot better with a temporary weakening Yen with the Nikkei 225 up more than 0.3% to 37114 points.
Daily price action was looking very keen indeed although daily momentum has slowed down somewhat this week after clearing resistance at the 36000 point level with another equity market that looks stretched and ready to rollover again here. Watch ATR support closely:
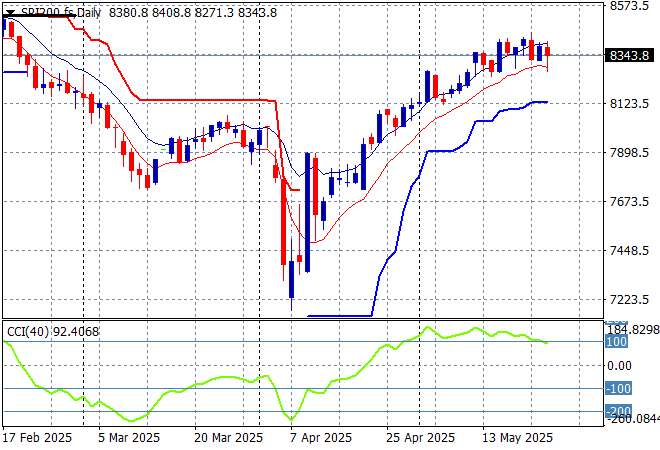
Australian stocks were able to swim along without much fuss with the ASX200 lifting just 0.2% at 8360 points.
SPI futures are down nearly 0.4% on the slump on Wall Street on Friday night. The daily chart pattern suggests further upside is still possible as the inverted head and shoulders pattern is nearly complete with the RBA cut helping boost this but correlation with other risk markets will come into play here – watch as daily momentum is slowly rolling over:
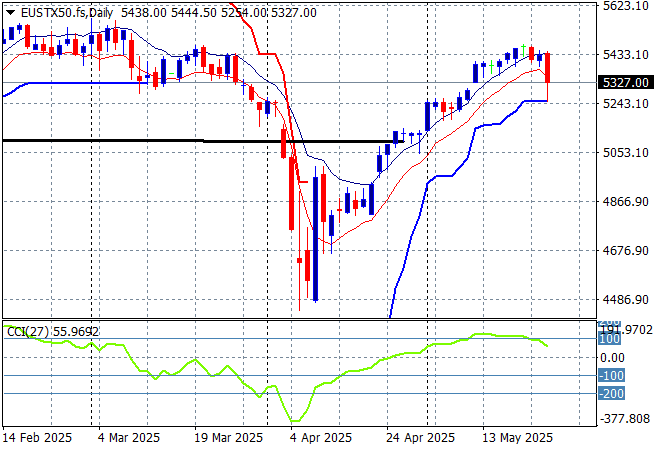
European markets had large selloffs across the continent almost in unison with the Eurostoxx 50 Index finishing 1.8% lower at 5324 points.
Support at the previous monthly support levels (black line) at 5100 points is now firmly held with the bounce off the 2024 lows at the 4400 point level indicating a massive fill of this dump and pump action with the former February highs nearly complete. A rollover is forming here so watch for support at the 5200 point level proper as the new “no deal” tariffs start to take effect:
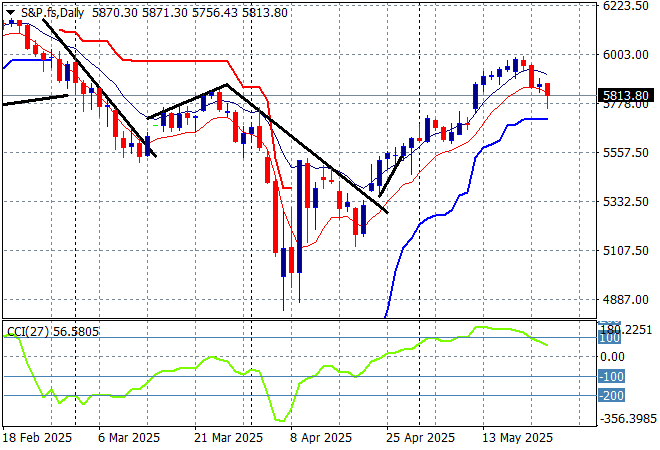
Wall Street continued to sell off with the NASDAQ down exactly 1% while the S&P500 lost nearly 0.7% to close at 5802 points.
The four hourly chart was previously supporting a potential slowdown action here that could be translating to a top on the daily chart as prices gets back above the pre-Trump Tariff Tax day. But the rollover here will catch up to economic reality as earnings multiples retract as the US economy shrinks even further due to the new “Big Beautiful Tax Bill” and the ridiculous tariffs on Europe:
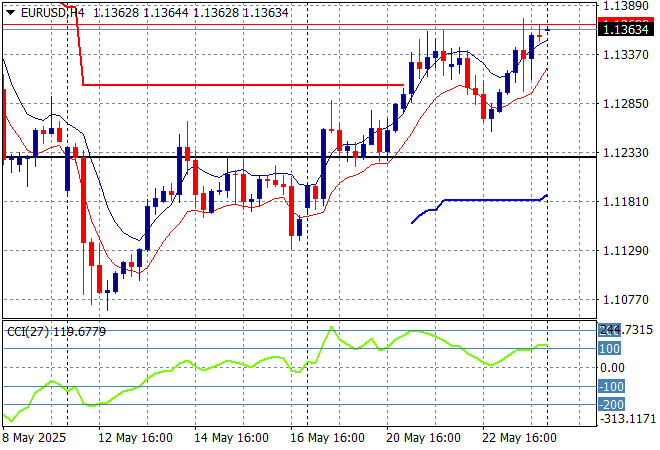
Currency markets are seeing a further move against King Dollar amid the tariff volatility and substantial weakening of the US Federal government fiscal situation with broad moves across the board. Pound Sterling was up nearly 2% last week while Euro made a new weekly high to get back above the 1.13 level after a mild mid week retracement.
The union currency was pushed back below the 1.13 handle previously but support bounced back at the 2023 and 2024 highs with a breakout above trailing ATR resistance on the four hourly chart as short and medium term momentum remains quite positive:
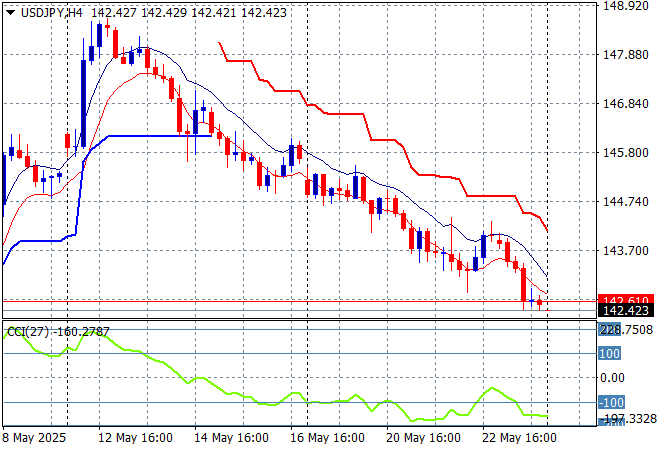
The USDJPY pair retraced all week to be pushed back below the 143 handle as the ructions around the Japanese sovereign bond market continued to widen but concerns over the US situation are not helping either.
I still contend we need to watch for any sustained break below the 139 level which completes a multi year bearish head and shoulders setup that could see the 110 to 120 level revisited. No trade deal is on the horizon either with the 10% baseline still holding:
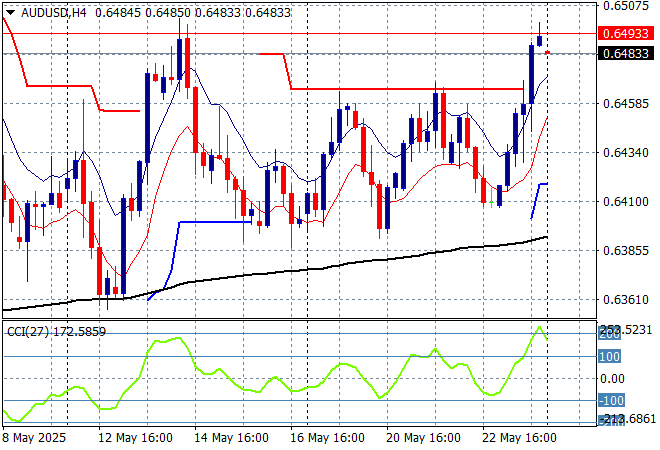
The Australian dollar was oscillating around the 64 cent handle against USD with the latest RBA rate cut absorbed and then some but has now pushed aside short term resistance to almost break through the 65 cent level on Friday night.
Stepping back for a longer point of view (and looking at the trusty AUDNZD weekly cross) price action has crossed back above the 200 day MA (moving black line) after bouncing off a near new five year low. This is all about the USD, not the Australian economy – or is it? – so I’m wary here but you’ve got to follow price, keeping an eye on temporary support at the 63 cent level:
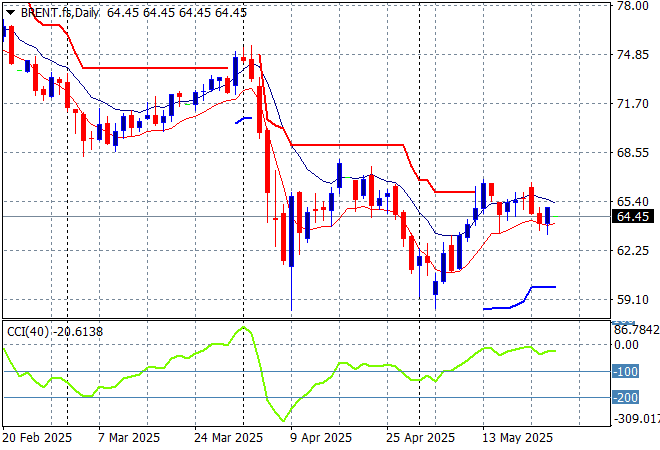
Oil markets are still trying hard but failing to hold onto the post tariff bounce as their face other geopolitical ructions and OPEC pushing supply with Brent crude pushed back down to the $64USD per barrel level again after failing to make a new weekly high.
The daily chart pattern shows the post New Year rally that got a little out of hand and now reverting back to the sideways lower action for the latter half of 2024. The potential for a return to the 2024 lows is still building here as domestic demand in the US is likely to continue to decline as the Trump Taxes take effect:
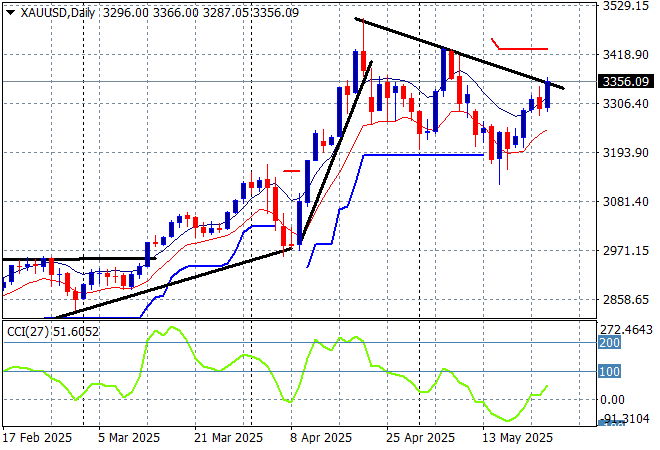
Gold pulled back in the previous session after a series of moves higher last week but was able to make a better effort on Friday night with a move back above the $3350USD per ounce level.
Short term support had firmed immensely in recent sessions showing real strength but momentum became considerably overbought so this was inevitable as price action has reverted back to the uptrend line from the April lows. There is further support at the $3200 level that could be tested next on the overshoot:
Glossary of Acronyms and Technical Analysis Terms:
ATR: Average True Range – measures the degree of price volatility averaged over a time period
ATR Support/Resistance: a ratcheting mechanism that follows price below/above a trend, that if breached shows above average volatility
CCI: Commodity Channel Index: a momentum reading that calculates current price away from the statistical mean or “typical” price to indicate overbought (far above the mean) or oversold (far below the mean)
Low/High Moving Average: rolling mean of prices in this case, the low and high for the day/hour which creates a band around the actual price movement
FOMC: Federal Open Market Committee, monthly meeting of Federal Reserve regarding monetary policy (setting interest rates)
DOE: US Department of Energy
Uncle Point: or stop loss point, a level at which you’ve clearly been wrong on your position, so cry uncle and get out/wrong on your position, so cry uncle and get out!