
Its all about bonds overnight with the Japanese selloff extending to US sovereign debt as the latest Trump “Tax” Deal (aka blowing out the deficit forever) and a weak 20 year auction saw yields rise to new heights across the curve. This led to a selloff on Wall Street and is ringing alarm bells across risk markets as it appears the Trump regime is also broadcasting that a 10% flat tariff is the best anyone can do with a trade deal.
The USD of course continues to be sold off against most of the majors with Euro and Pound Sterling making new weekly highs while the Canadian Loonie continued to firm alongside the Australian dollar which has absorbed all of the RBA cut but is finding resistance above the 64 cent level.
10 and 30 year Treasury yields lifted more than 10 basis points with the former settling at the 4.5% level while oil prices remain somewhat weak with Brent crude still stuck around the $65USD per barrel level. Meanwhile gold is trying much harder after almost crossing below the $3200USD per ounce level on Friday night, now surging above the $3300 level this morning.
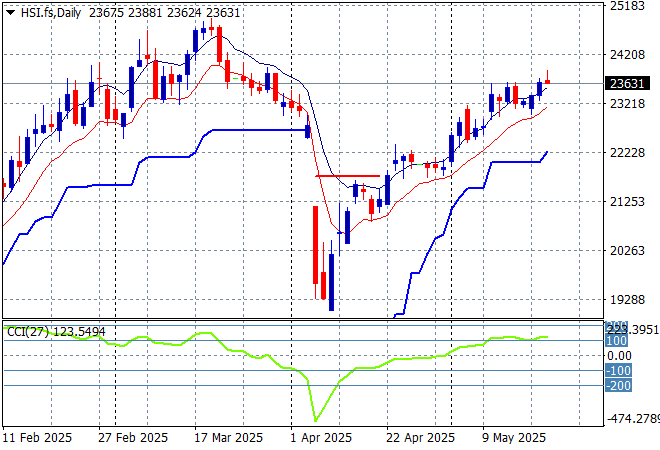
Looking at stock markets from Asia from yesterday’s session, where mainland Chinese share markets did better in morning trade but slid back in the afternoon session with the Shanghai Composite up just 0.2% while the Hang Seng Index gained more than 0.6% to almost push above the 24000 point level.
The daily chart shows a near complete fill of the March/April selloff although momentum is now picking up again and remains slightly overbought as the 90 day “relief” continues without any further positive news:
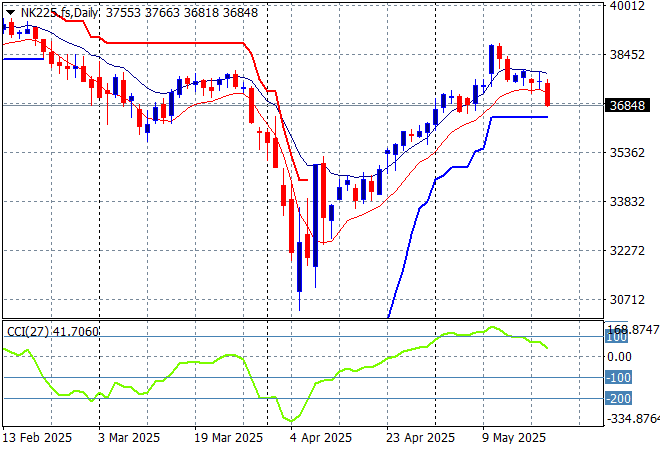
Japanese stock markets were the odd ones out on the concerning selloff in bonds and the strengthening Yen with the Nikkei 225 down more than 0.6% to 37328 points.
Daily price action was looking very keen indeed although daily momentum has slowed down somewhat this week after clearing resistance at the 36000 point level with another equity market that looks stretched and ready to rollover again here:
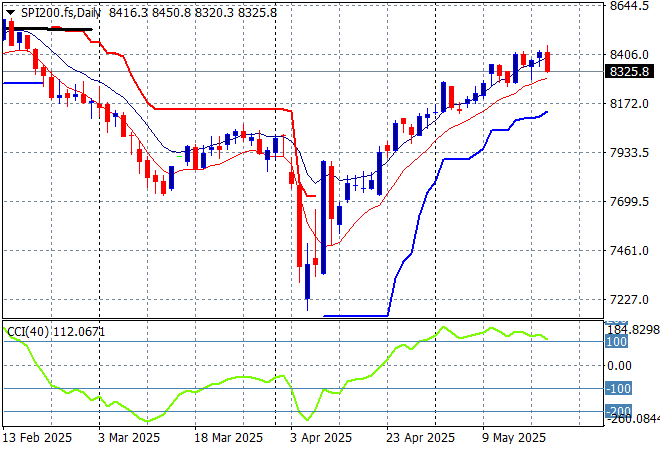
Australian stocks were able to put in another solid session to extend its wins for the week with the ASX200 up 0.5% at 8386 points.
SPI futures however are down nearly 1% due to the selloff on Wall Street overnight. The daily chart pattern suggests further upside is still possible as the inverted head and shoulders pattern is nearly complete with the RBA cut helping boost this but correlation with other risk markets will come into play here – watch as daily momentum is slowly rolling over:
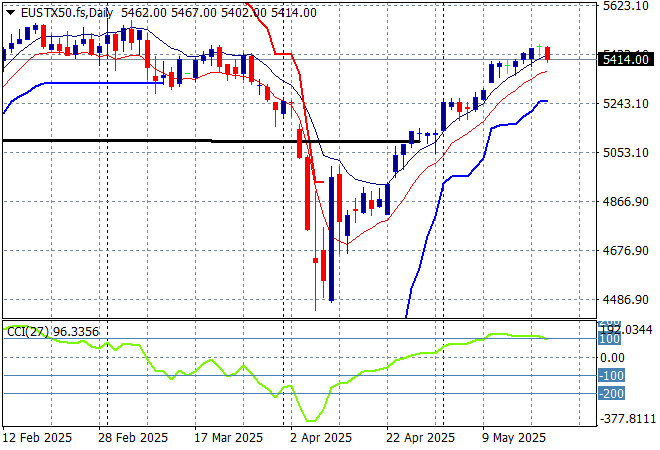
European markets had very staid sessions across the continent with only the German DAX advancing with the Eurostoxx 50 Index finishing dead flat at 5454 points.
Support at the previous monthly support levels (black line) at 5100 points is now firmly held with the bounce off the 2024 lows at the 4400 point level indicating a massive fill of this dump and pump action with the former February highs nearly complete. Potentially further cuts from the ECB may help support this rally but again, Wall Street will march this beat:
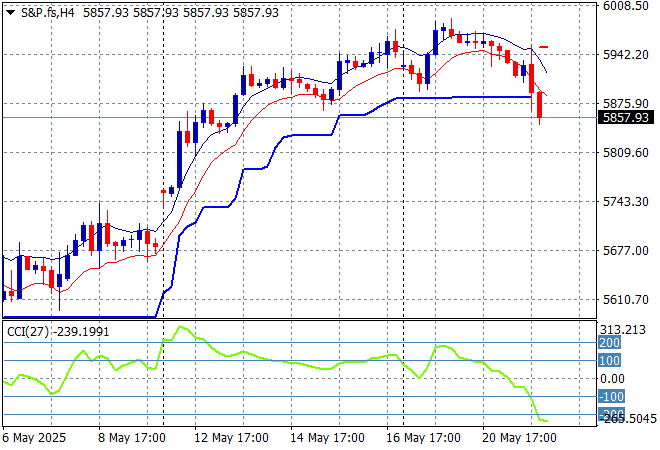
Wall Street stalled in the previous session and then fell over into the dirt overnight with the NASDAQ off by 1.4% while the S&P500 lost more than 1.6% lower at the end closing at 5844 points.
The four hourly chart was previously supporting a potential slowdown action here that could be translating to a top on the daily chart as prices gets back above the pre-Trump Tariff Tax day. But the rollover here will catch up to economic reality as earnings multiples retract as the US economy shrinks:
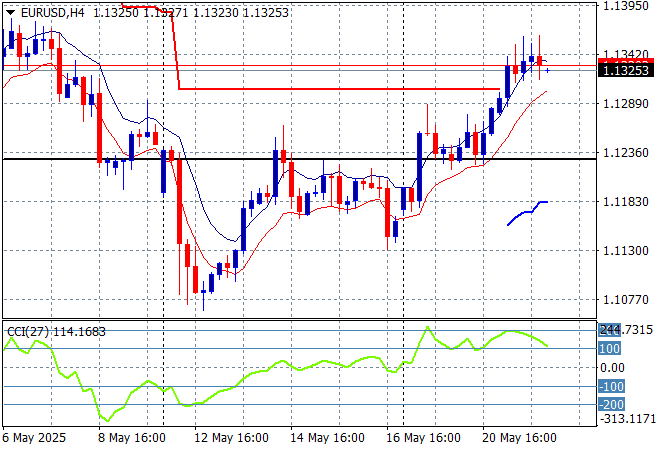
Currency markets are fast coming back against USD following the Moody cut from Friday night and the ructions on bond markets with Euro getting well above the 1.13 handle overnight, as Pound Sterling also pushed up to a new weekly high and the Loonie and other peripheral currencies all push King Dollar off its gilded but worn throne.
The union currency was pushed back below the 1.13 handle last week as support bounced back to the 1.12 level which corresponds to the 2023 and 2024 highs but a potential breakout above trailing ATR resistance here on the four hourly chart is brewing although momentum is overbought for now:
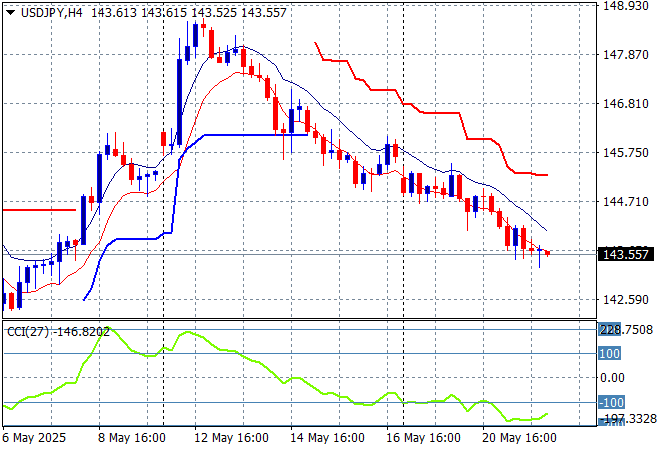
The USDJPY pair retraced all last trading week after getting way ahead of itself at the 149 level, and continues to be pushed back below to the 144 handle as the ructions around the Japanese sovereign bond market continue to widen.
I still contend we need to watch for any sustained break below the 139 level which completes a multi year bearish head and shoulders setup that could see the 110 to 120 level revisited. No trade deal is on the horizon either with the 10% baseline still holding:
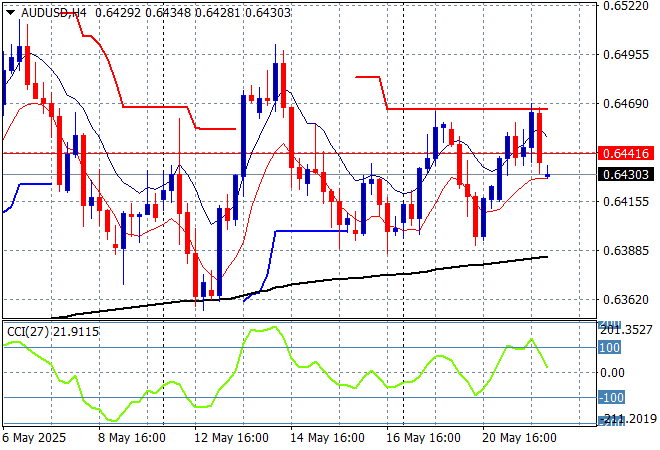
The Australian dollar is oscillating around the 64 cent handle against USD with the latest RBA rate cut absorbed and then some but its coming up against short term resistance as a risk proxy.
Stepping back for a longer point of view (and looking at the trusty AUDNZD weekly cross) price action has crossed back above the 200 day MA (moving black line) after bouncing off a near new five year low. This is all about the USD, not the Australian economy – or is it? – so I’m wary here but you’ve got to follow price, keeping an eye on temporary support at the 63 cent level:
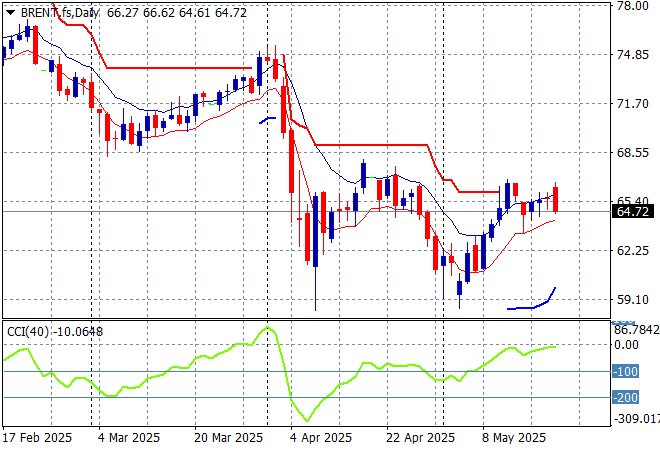
Oil markets are trying hard to hold onto its post tariff bounce but continue to face other geopolitical ructions and OPEC pushing supply with Brent crude still stuck around the $65USD per barrel level again after recently almost making a new weekly low.
The daily chart pattern shows the post New Year rally that got a little out of hand and now reverting back to the sideways lower action for the latter half of 2024. The potential for a return to the 2024 lows is still building here as domestic demand in the US is likely to continue to decline as the Trump Taxes take effect:
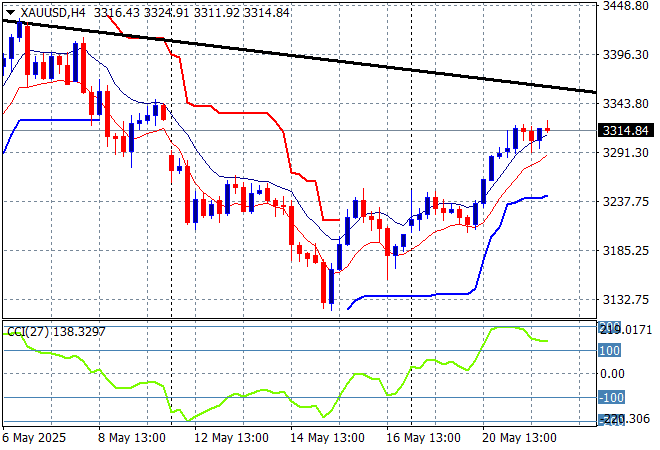
Gold pulled back again on Friday night after sharply moving higher in recent weeks as it got way ahead of itself at least on the short term charts but is now making a very solid effort to get back on track back as it breached the $3300USD per ounce level overnight.
Short term support had firmed immensely in recent sessions showing real strength but momentum became considerably overbought so this was inevitable as price action has reverted back to the uptrend line from the April lows. There is further support at the $3200 level that could be tested next on the overshoot:
Glossary of Acronyms and Technical Analysis Terms:
ATR: Average True Range – measures the degree of price volatility averaged over a time period
ATR Support/Resistance: a ratcheting mechanism that follows price below/above a trend, that if breached shows above average volatility
CCI: Commodity Channel Index: a momentum reading that calculates current price away from the statistical mean or “typical” price to indicate overbought (far above the mean) or oversold (far below the mean)
Low/High Moving Average: rolling mean of prices in this case, the low and high for the day/hour which creates a band around the actual price movement
FOMC: Federal Open Market Committee, monthly meeting of Federal Reserve regarding monetary policy (setting interest rates)
DOE: US Department of Energy
Uncle Point: or stop loss point, a level at which you’ve clearly been wrong on your position, so cry uncle and get out/wrong on your position, so cry uncle and get out!