
Uncertainty seems to be returning to risk markets if you look beyond the headline stock indices with the Moody rating cut still reverberating amid geopolitical concerns over Russia, Gaza and the impending hurt from the Trump tariffs. US sovereign debt concerns were on the mind of more than one overnight Fed speaker and while the UK maybe looking to reverse its Brexit trade relations with the EU, there are no other trade deals on the horizon for the Trump regime.
The USD was initially sold off abruptly against the majors before rebounding somewhat although Euro and Pound Sterling are making new weekly highs. The Australian dollar also firmed above the 64 cent level as traders await today’s RBA meeting and an expected rate cut.
10 year Treasury yields were initially above the 4.5% level (with the 30 year briefly breaking the 5% level) before returning to the 4.4% level while oil prices remain somewhat weak despite recent rallies with Brent crude remaining slightly above the $65USD per barrel level. Meanwhile gold is trying after almost crossing below the $3200USD per ounce level on Friday night, with a small lift above the $3220 level this morning.
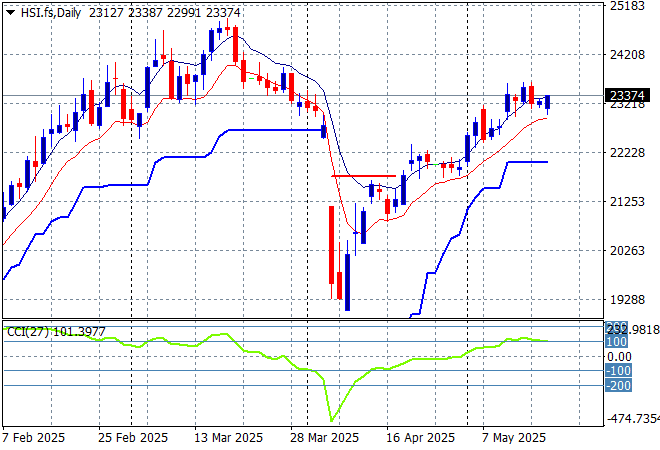
Looking at stock markets from Asia from yesterday’s session, where mainland Chinese share markets were again slightly lower going into afternoon trade with the Shanghai Composite just above the 3360 point level while the Hang Seng Index lost just 0.1% to remain above the 23000 point level.
The daily chart shows a near complete fill of the March/April selloff but momentum is slowly down as the 90 day “relief” continues without any further positive news:
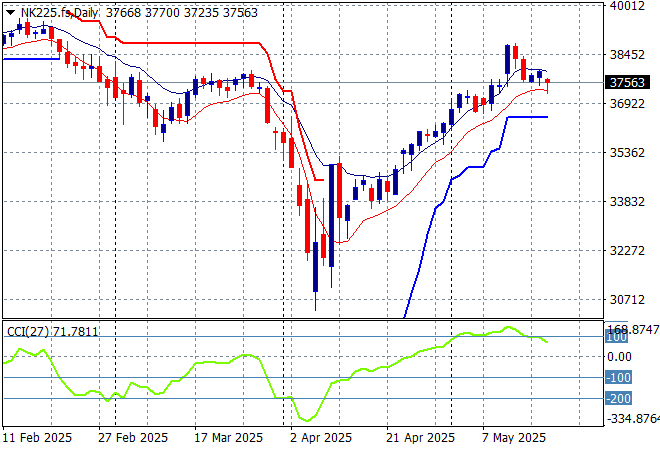
Japanese stock markets were further back however on the stronger Yen with the Nikkei 225 down more than 0.6% to 37508 points.
Daily price action is looking very keen indeed although daily momentum has slowed down somewhat, it has cleared resistance at the 36000 point level with another equity market that looks stretched:
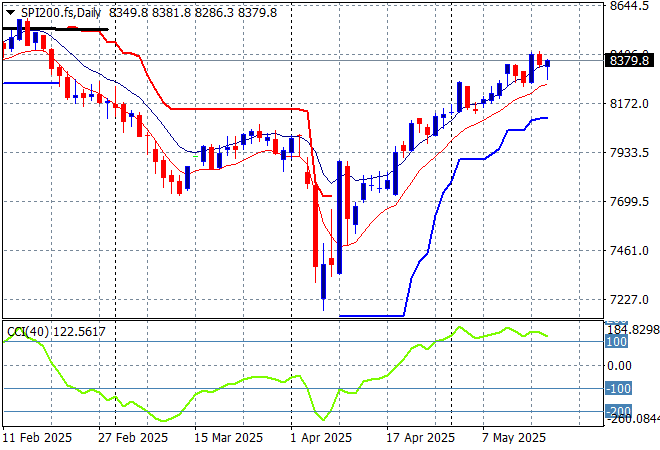
Australian stocks have slid back somewhat with the ASX200 losing just over 0.5% to close at 8295 points.
SPI futures are up more than 0.7% despite the lack of a solid session on Wall Street overnight. The daily chart pattern suggests further upside is still possible as the inverted head and shoulders pattern is nearly complete with all eyes on the next RBA cut to help boost this even further:
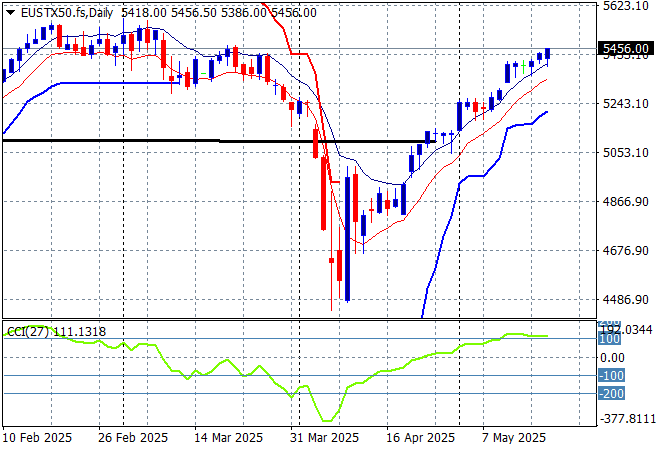
European markets had very mixed sessions across the continent with the German DAX advancing 0.7% but peripheral markets pulled the Eurostoxx 50 Index back as it finished dead flat at 5427 points.
Support at the previous monthly support levels (black line) at 5100 points is now firmly held with the bounce off the 2024 lows at the 4400 point level indicating a massive fill of this dump and pump action with the former February highs now in sight:
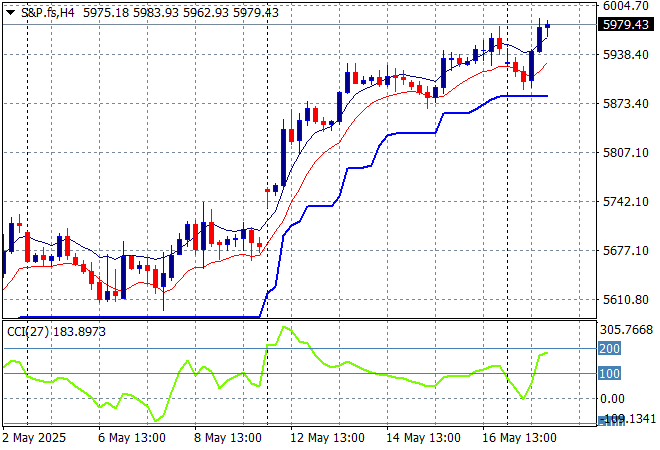
Wall Street was also in a similar pickle with little movement in the physical sessions with the NASDAQ and the S&P500 finishing with scratch sessions, the latter up just 0.1% to almost get back above the 6000 point level, closing at 5963 points.
Everything is awesome according to the daily chart as prices gets back above the pre-Trump Tariff Tax day and are now barrelling in on the former highs as hopium spreads that there will be zero impact to earnings:
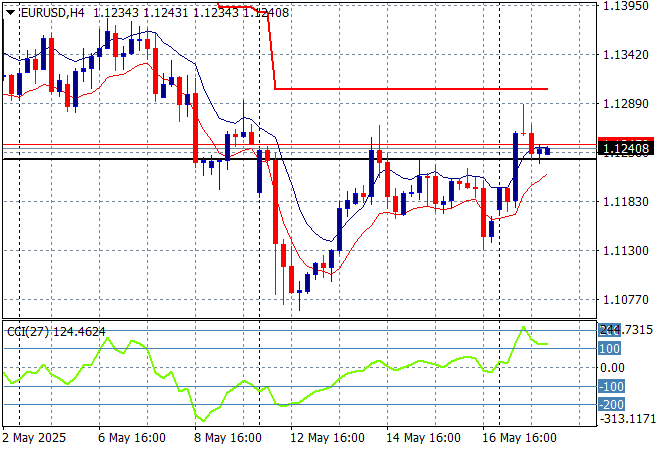
Currency markets are still trying to understand fact from fiction with the USD still quite mixed against the majors following the Moody cut with Euro getting back above the 1.12 handle overnight, with Pound Sterling also pushed up to a new weekly high.
The union currency was pushed back below the 1.13 handle last week as we watch for support to bounce back at the 1.12 level which corresponds to the 2023 and 2024 highs but wait and see if there’s a significant breakout above trailing ATR resistance here on the four hourly chart:
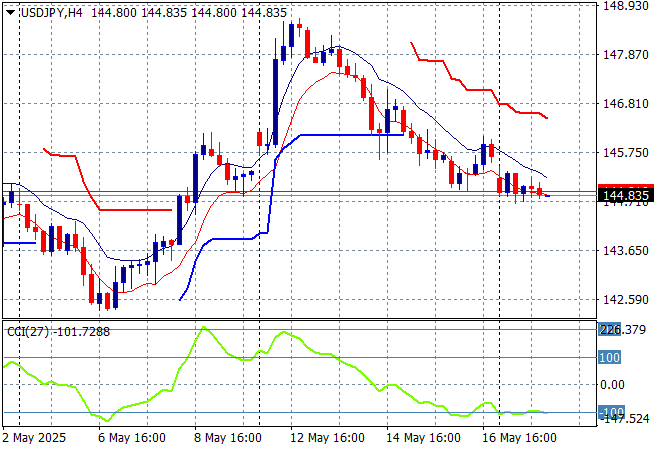
The USDJPY pair retraced all last trading week after getting way ahead of itself at the 149 level, now back down to the 144 handle with the potential to break below in the coming session.
I still contend we need to watch for any sustained break below the 139 level which completes a multi year bearish head and shoulders setup that could see the 110 to 120 level revisited. No trade deal yet!
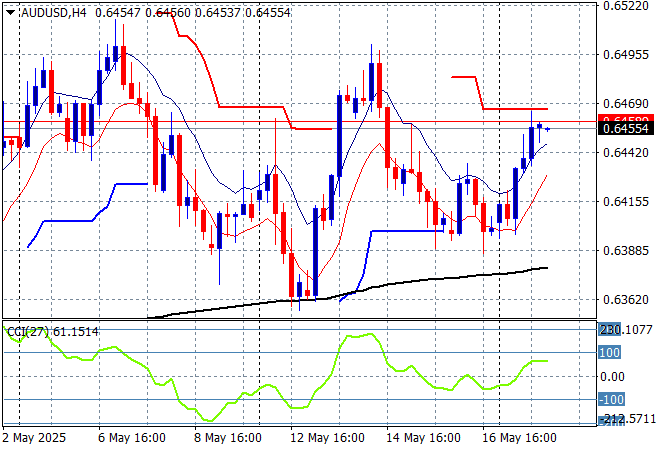
The Australian dollar was previously slowly extending its gains above the 64 cent level to extend above the pre-tariff announcement levels, with a mild pull back looking to be filled again as we await today’s RBA meeting and guidance.
Stepping back for a longer point of view (and looking at the trusty AUDNZD weekly cross) price action has crossed back above the 200 day MA (moving black line) after bouncing off a near new five year low. This is all about the USD, not the Australian economy – or is it? – so I’m wary here but you’ve got to follow price, keeping an eye on temporary support at the 63 cent level:
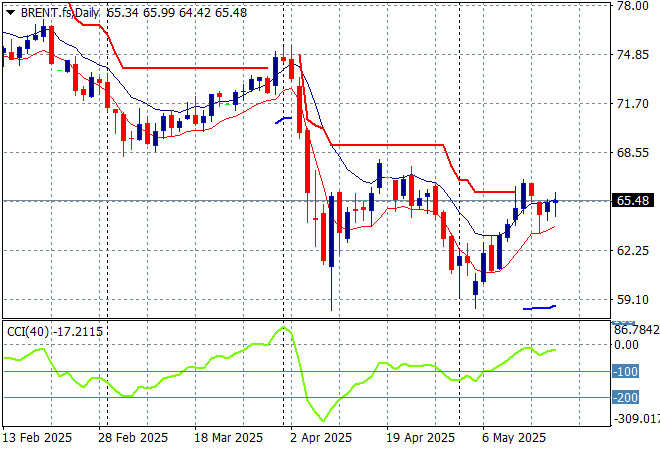
Oil markets are failing to hold onto its post tariff bounce but are facing other geopolitical ructions with Brent crude pushed around the $65USD per barrel level again after recently almost making a new weekly low.
The daily chart pattern shows the post New Year rally that got a little out of hand and now reverting back to the sideways lower action for the latter half of 2024. The potential for a return to the 2024 lows is still building here as domestic demand in the US is likely to continue to decline as the Trump Taxes take effect:
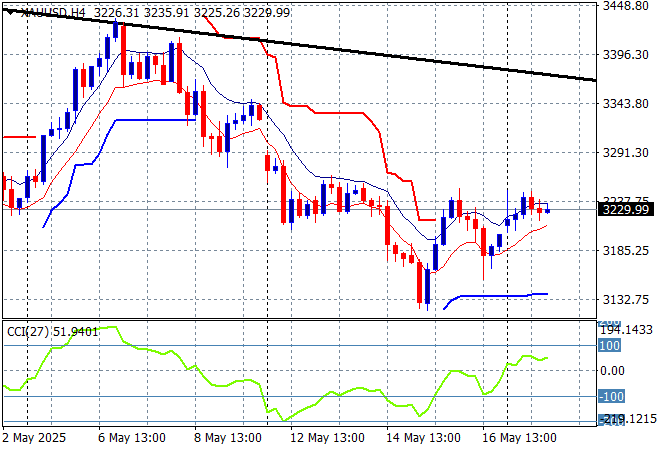
Gold pulled back again on Friday night after sharply moving higher in recent weeks as it got way ahead of itself at least on the short term charts but is now trying to make any effort to get back on track back above the $3200USD per ounce level.
Short term support had firmed immensely in recent sessions showing real strength but momentum became considerably overbought so this was inevitable as price action has reverted back to the uptrend line from the April lows. There is further support at the $3200 level that could be tested next on the overshoot:
Glossary of Acronyms and Technical Analysis Terms:
ATR: Average True Range – measures the degree of price volatility averaged over a time period
ATR Support/Resistance: a ratcheting mechanism that follows price below/above a trend, that if breached shows above average volatility
CCI: Commodity Channel Index: a momentum reading that calculates current price away from the statistical mean or “typical” price to indicate overbought (far above the mean) or oversold (far below the mean)
Low/High Moving Average: rolling mean of prices in this case, the low and high for the day/hour which creates a band around the actual price movement
FOMC: Federal Open Market Committee, monthly meeting of Federal Reserve regarding monetary policy (setting interest rates)
DOE: US Department of Energy
Uncle Point: or stop loss point, a level at which you’ve clearly been wrong on your position, so cry uncle and get out/wrong on your position, so cry uncle and get out!