
The Trump regime continues to goose the stock market with non-existent reports of trade deals with “hundreds of countries” while the economic reality continues to set in as the latest initial jobless claims spiked while the ISM manufacturing survey went into contraction territory. Trump may need to up his Macca’s order as well as the Golden Arches company announced a downgrade in earnings although the NASDAQ rallied on Apple and Amazon earnings reports. The USD was mixed against the majors with Yen selling dominating while Euro and Pound Sterling pulled back further while the Australian dollar is just holding on at ore below the 64 cent level.
10 year Treasury yields are in a flux again steadying at the 4.2% level while oil prices fell sharply once more after failing to build support with Brent crude pushed below the $60USD per barrel level. Meanwhile gold is failing to recover as it drops more than $50 below the $3300USD per ounce level despite short term USD weakness.
Looking at stock markets from Asia from yesterday’s session, where Chinese share markets remain closed until next Wednesday for Labour Day celebrations.
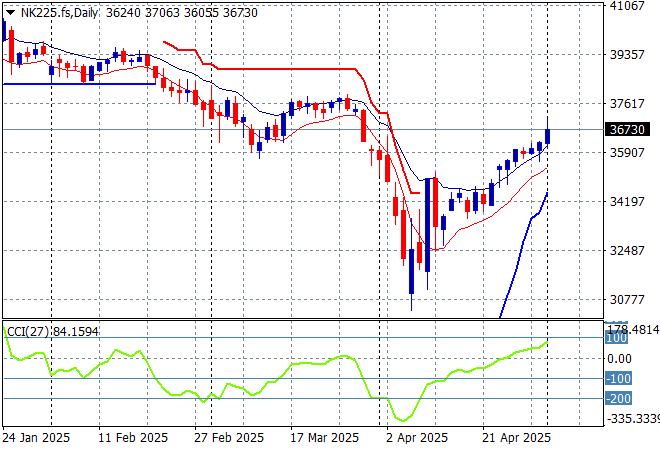
Japanese stock markets were up strongly on the BOJ hold with the Nikkei 225 lifting more than 1% higher to 36452 points.
Price action was also displaying a classic dead cat bounce pattern but daily momentum has been able to get back into positive readings and is now challenging resistance at the 36000 point level:
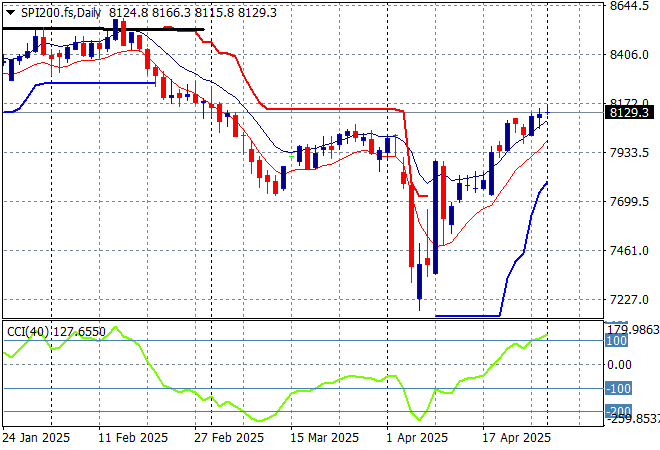
Australian stocks have managed a steady session with the ASX200 up just 0.2% at 8145 points.
SPI futures are somewhat flat with the potential for a volatile open given the very mixed session on Wall Street overnight. The daily chart pattern suggests further downside could be inevitable as the Chinese counter-counter tariffs take effect but watch for a potential short covering rally past the 8000 point level first with resistance at the 8200 the real level to beat before the next RBA cut:
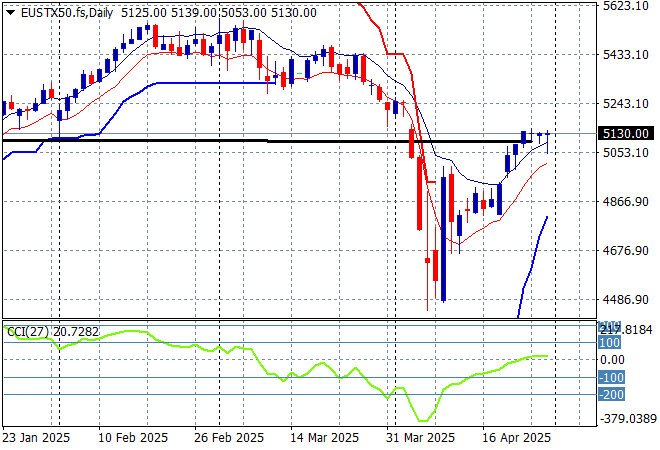
European markets again had to absorb the Wall Street volatility but managed a flat night with the Eurostoxx 50 Index finishing with a scratch session at 5160 points.
Support at the previous monthly support levels (black line) at 5100 points failed to hold so 2024 lows at the 4400 point level are still in sight, but there maybe life yet in this dead cat bounce if it can clear the 5200 point level:
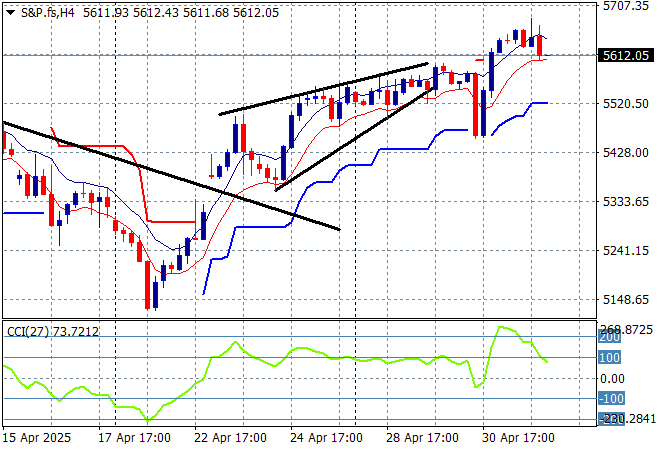
Wall Street however was able to rally somewhat in the physical session with the NASDAQ gaining more than 1.4% while the S&P500 pushed 0.6% higher to finally get back above the 5600 point level.
The intrasession volatility is still quite evident on the four hourly chart as this market is still beholden to literal fake news about tariff “deals” despite the reality of the situation. Futures retraced after the close so this may not hold going into tonight’s NFP print:
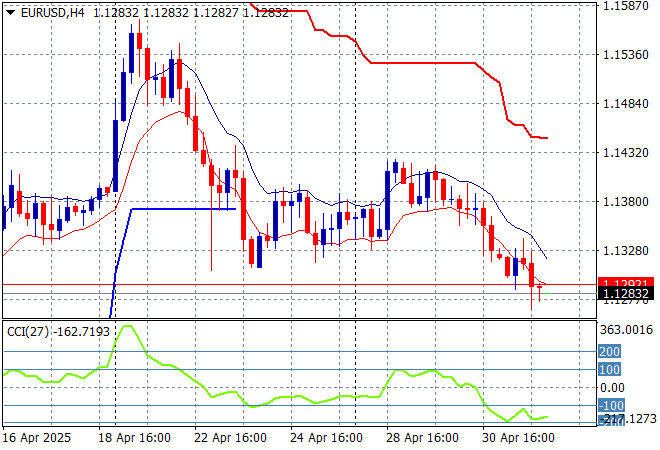
Currency markets are still trying to understand fact from fiction with the USD still quite mixed against the majors although Euro continued to fall overnight as it gave up its start of week breakout to finish just below the 1.13 level while Pound Sterling also pulled back from its new three year high.
The union currency was pushed back down to the 1.13 handle last week as we watch for support to bounce back at the 1.12 level which corresponds to the 2023 and 2024 highs but it seems all traders are awaiting tonights NFP print – let’s see if Mango Mussolini will try to spin this one as Biden’s fault too!
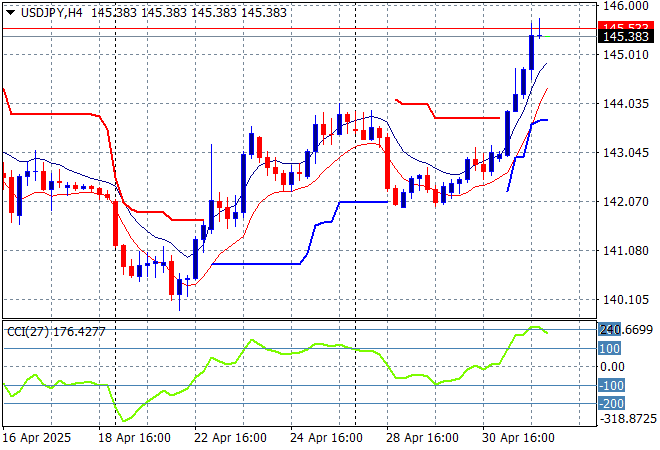
The USDJPY pair recently dropped sharply down to the 142 level but has since broken out sharply where it built much higher overnight with a move up through the 145 level in what looks like an unsustainable breakout.
I still contend we need to watch for any sustained break below the 139 level which completes a multi year bearish head and shoulders setup that could see the 110 to 120 level revisited but in the short term its now put aside resistance at the 144 level so this theory might need revisision!
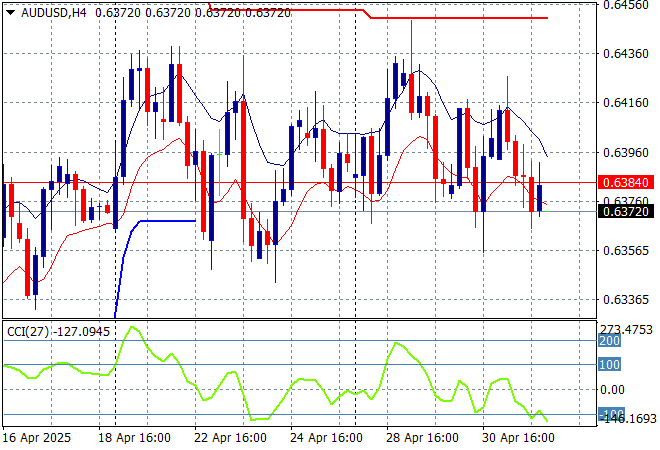
The Australian dollar was previously slowly extending its gains above the 64 cent level to extend above the pre-tariff announcement levels, but has pulled back again below that level in another unsure session overnight.
Stepping back for a longer point of view (and looking at the trusty AUDNZD weekly cross) price action has crossed back above the 200 day MA (moving black line) after bouncing off a near new five year low. This is all about the USD, not the Australian economy so I’m wary here but you’ve got to follow price, keeping an eye on temporary support at the 63 cent level:
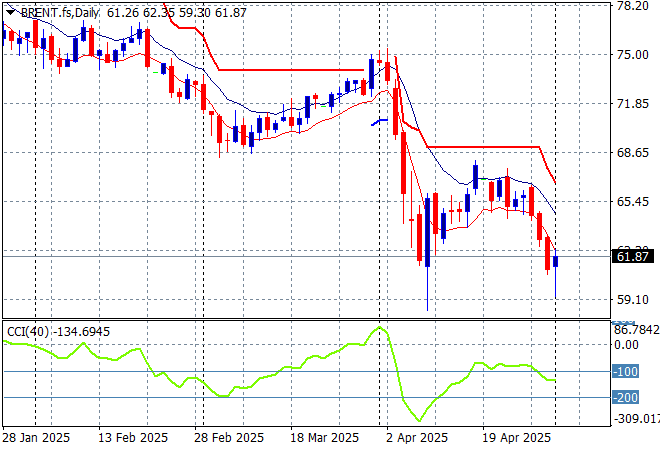
Oil markets are failing to hold onto its post tariff bounce but are facing other geopolitical ructions with Brent crude pushed below the $60USD per barrel level to almost make a new weekly low after recovering above that level later in the session.
The daily chart pattern shows the post New Year rally that got a little out of hand and now reverting back to the sideways lower action for the latter half of 2024. The potential for a return to the 2024 lows is still building here as domestic demand in the US is likely to collapse despite the very short term change in sentiment:
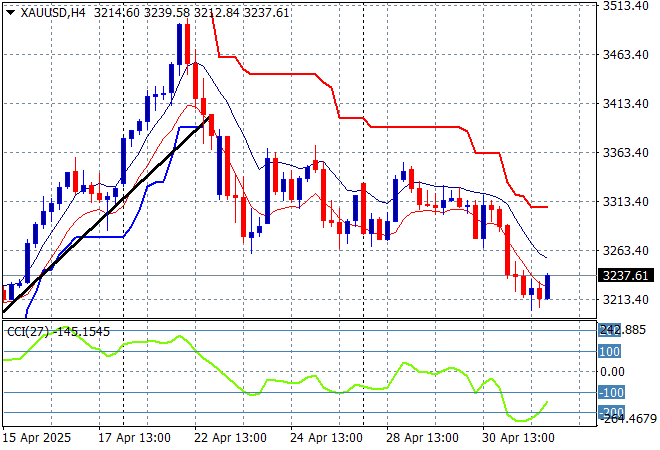
Gold pulled back somewhat on Friday night after sharply moving higher in recent weeks as it got way ahead of itself at least on the short term charts but is now failing to make any effort to get back on track as it slides another $50 lower to remain well below the $3300USD per ounce level overnight.
Short term support had firmed immensely in recent sessions showing real strength but momentum became considerably overbought so this was inevitable as price action has reverted back to the uptrend line from the April lows. There is further support at the $3200 level that could be tested next on the overshoot:
Glossary of Acronyms and Technical Analysis Terms:
ATR: Average True Range – measures the degree of price volatility averaged over a time period
ATR Support/Resistance: a ratcheting mechanism that follows price below/above a trend, that if breached shows above average volatility
CCI: Commodity Channel Index: a momentum reading that calculates current price away from the statistical mean or “typical” price to indicate overbought (far above the mean) or oversold (far below the mean)
Low/High Moving Average: rolling mean of prices in this case, the low and high for the day/hour which creates a band around the actual price movement
FOMC: Federal Open Market Committee, monthly meeting of Federal Reserve regarding monetary policy (setting interest rates)
DOE: US Department of Energy
Uncle Point: or stop loss point, a level at which you’ve clearly been wrong on your position, so cry uncle and get out/wrong on your position, so cry uncle and get out!