
The latest US GDP print for Q1 came in worse than expected, sending Wall Street down 2% at one stage before the hopium set in as markets recovered towards the close on reports of a possible Canadian deal with the new PM. The USD was mixed against the majors with some return to strength against Euro and Pound Sterling but more ground lost against the Canadian Loonie while the Australian dollar is just holding on at the 64 cent level in the wake of yesterday’s “good” inflation print.
10 year Treasury yields are also slipping again with a move back below the 4.2% level while oil prices fell sharply after failing to build support with Brent crude pushed below the $61USD per barrel level. Meanwhile gold is trying to recover as it steadies above the $3300USD per ounce level amid general USD weakness.
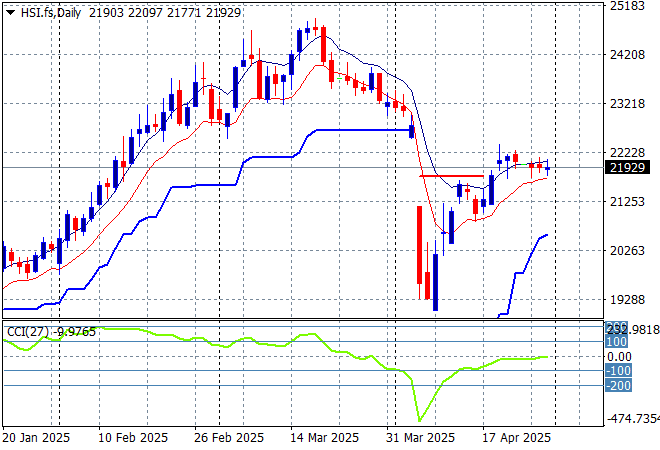
Looking at stock markets from Asia from yesterday’s session, where Chinese share markets were again slightly lower going into afternoon trade with the Shanghai Composite still below the 3300 point level while the Hang Seng Index lifted 0.5% to remain above the 22000 point level. Markets will be closed until next Wednesday for Labour Day celebrations.
The Hang Seng Index daily chart shows a classic dead cat bounce setup following the collapse below the 20000 point level, with the rollover not yet in place despite the trade war with the US. This looks like a potential rally if traders can believe the headlines but needs to firmly move above the 22000 point area to clear local resistance:
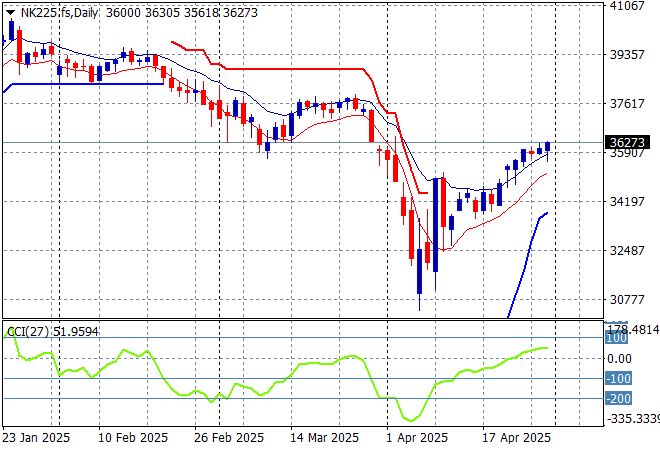
Japanese stock markets were back from holidays with the Nikkei 225 playing catchup to lift 0.4% to 35986 points.
Price action was also displaying a classic dead cat bounce pattern but daily momentum has been able to get back into positive readings and is now challenging resistance at the 36000 point level:
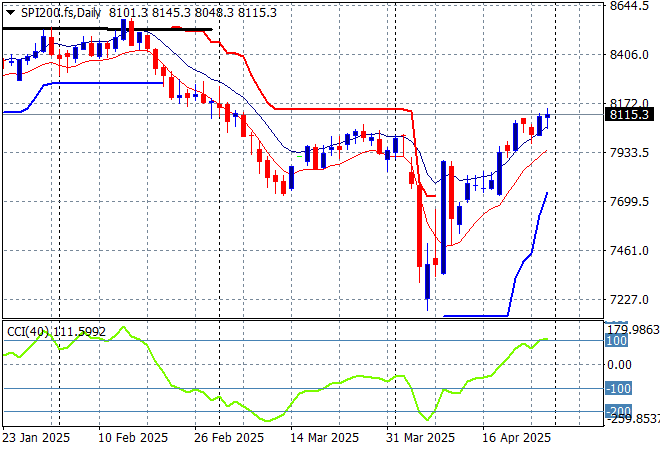
Australian stocks have managed a very solid session with the ASX200 up more than 1% at 8126 points.
SPI futures are somewhat flat with the potential for a volatile open given the very mixed session on Wall Street overnight. The daily chart pattern suggests further downside could be inevitable as the Chinese counter-counter tariffs take effect but watch for a potential short covering rally past the 8000 point level first with resistance at the 8200 the real level to beat before the next RBA cut:
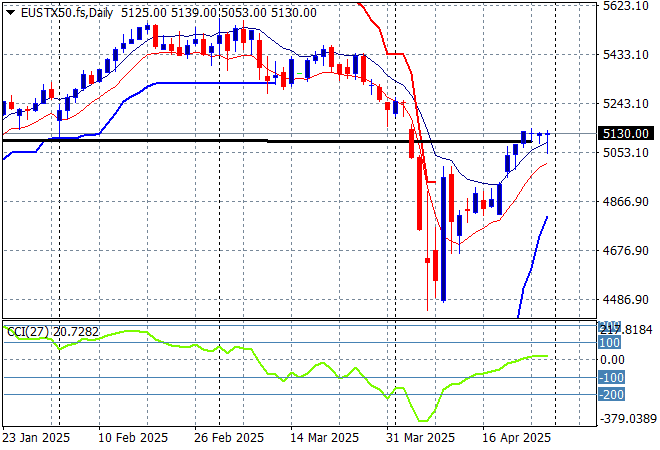
European markets had to absorb the Wall Street volatility later in the session with some retracements in peripheral markets again sending the Eurostoxx 50 Index slightly lower at 5160 points.
Support at the previous monthly support levels (black line) at 5100 points failed to hold so 2024 lows at the 4400 point level are still in sight, but there maybe life yet in this dead cat bounce if it can clear the 5200 point level:
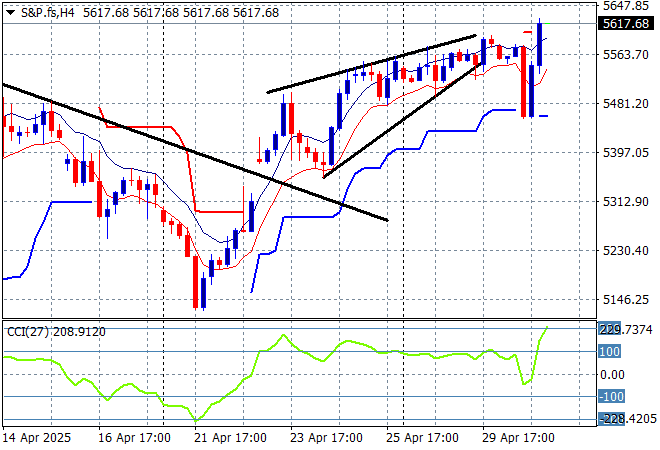
Wall Street eventually had a flat night after the GDP print reaction but both NASDAQ and the S&P500 are looking weak here with scratch sessions as the latter closing at the 5569 point level.
The intrasession volatility is quite evident on the four hourly chart as this market is still beholden to literal fake news about tariff “deals” despite the reality of the situation:
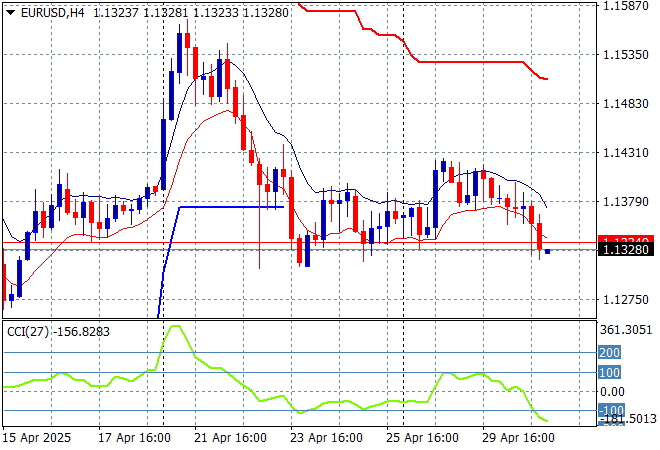
Currency markets are still trying to understand fact from fiction with the USD still quite mixed against the majors although Euro dwindled a bit overnight as it gave up its start of week breakout to finish just above the 1.13 level while Pound Sterling also pulled back from its new three year high.
The union currency was pushed back down to the 1.13 handle last week as we watch for support to bounce back at the 1.12 level which corresponds to the 2023 and 2024 highs but it seems all traders are awaiting tomorrow nights NFP print – let’s see if Mango Mussolini will try to spin this one as Biden’s fault too!
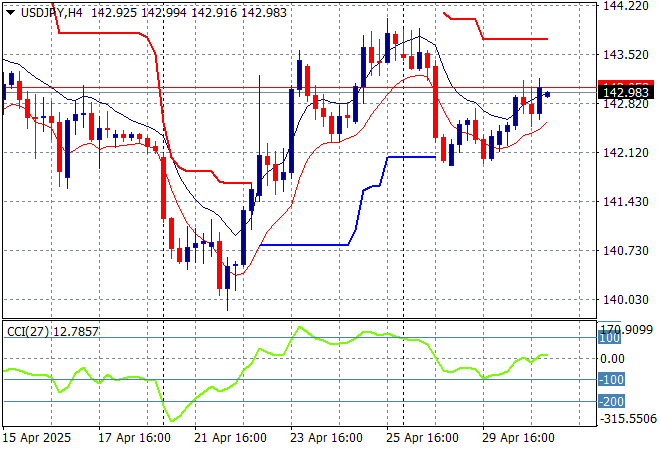
The USDJPY pair recently dropped sharply down to the 142 level but has since steadied and built higher overnight with a move up towards the 143 level.
Watch for any sustained break below the 139 level next which completes a multi year bearish head and shoulders setup that could see the 110 to 120 level revisited but in the short term its firming up against resistance at the 144 level;
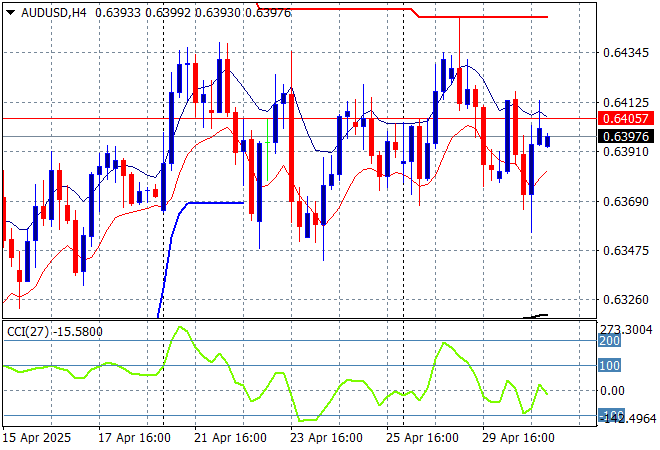
The Australian dollar was previously slowly extending its gains above the 64 cent level to extend above the pre-tariff announcement levels, but has pulled back again below that level in another unsure session overnight.
Stepping back for a longer point of view (and looking at the trusty AUDNZD weekly cross) price action has crossed back above the 200 day MA (moving black line) after bouncing off a near new five year low. This is all about the USD, not the Australian economy so I’m wary here but you’ve got to follow price, keeping an eye on temporary support at the 63 cent level:
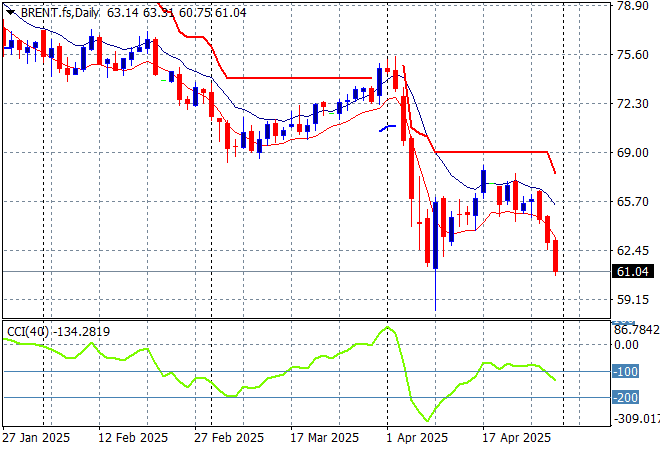
Oil markets are trying hard to hold onto its post tariff pause bounce but are facing other geopolitical ructions with Brent crude pushed down towards the $61USD per barrel level to make a new weekly low.
The daily chart pattern shows the post New Year rally that got a little out of hand and now reverting back to the sideways lower action for the latter half of 2024. The potential for a return to the 2024 lows is still building here as domestic demand in the US is likely to collapse despite the very short term change in sentiment:
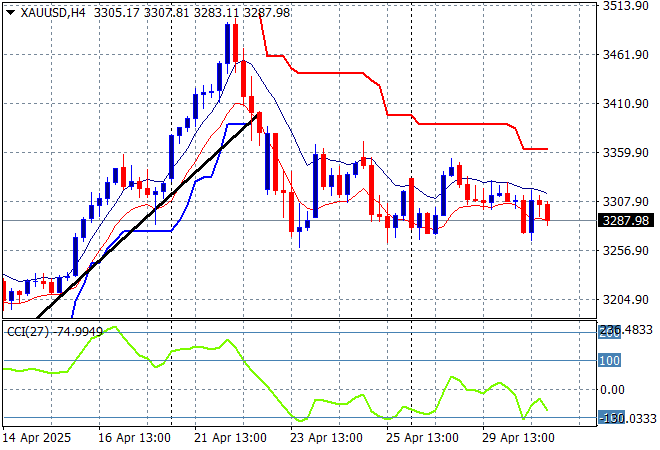
Gold pulled back somewhat on Friday night after sharply moving higher in recent weeks as it got way ahead of itself at least on the short term charts but is now trying to make another more sustained effort above the $3300USD per ounce level but had a very flat session overnight.
Short term support had firmed immensely in recent sessions showing real strength but momentum became considerably overbought so this was inevitable as price action has reverted back to the uptrend line from the April lows. There is further support at the $3200 level that could be tested next on the overshoot:
Glossary of Acronyms and Technical Analysis Terms:
ATR: Average True Range – measures the degree of price volatility averaged over a time period
ATR Support/Resistance: a ratcheting mechanism that follows price below/above a trend, that if breached shows above average volatility
CCI: Commodity Channel Index: a momentum reading that calculates current price away from the statistical mean or “typical” price to indicate overbought (far above the mean) or oversold (far below the mean)
Low/High Moving Average: rolling mean of prices in this case, the low and high for the day/hour which creates a band around the actual price movement
FOMC: Federal Open Market Committee, monthly meeting of Federal Reserve regarding monetary policy (setting interest rates)
DOE: US Department of Energy
Uncle Point: or stop loss point, a level at which you’ve clearly been wrong on your position, so cry uncle and get out/wrong on your position, so cry uncle and get out!