

The drums of war are still beating but the softer than expected PPI print in the US finally pushed risk around overnight as Wall Street surged and USD flopped against most of the currency majors. Euro almost hit the 1.10 handle while the Australian dollar finally got out of its holding pattern to clear the 66 cent level.
10 year Treasury yields pulled back again, down 6 points to settle well below the 3.9% level while oil prices are building in volatility in response to the looming action from Iran although Brent crude failed to keep above the $82USD per barrel level. Gold is also surging back, exceeding its previous weekly high to settle above the $2470USD per ounce level in a strong move.
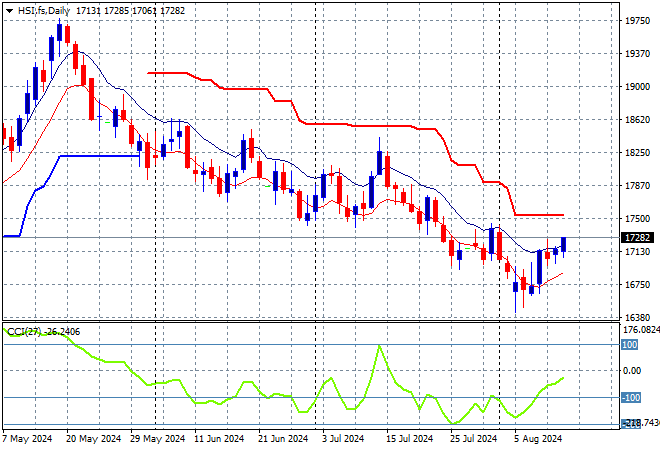
Looking at markets from yesterday’s session in Asia, where Chinese share markets are still struggling to find any traction as economic concerns continue to weigh down sentiment as the Shanghai Composite falls more than 0.3% going into the close while the Hang Seng Index is up slightly at 17128 points.
The Hang Seng Index daily chart was starting to look more optimistic a few months back but price action has slid down from the 19000 point level and continues to deflate in a series of steps as the Chinese economy slows. A few false breakouts have all reversed course and another downside move is looming here as the 17000 point level is broken:
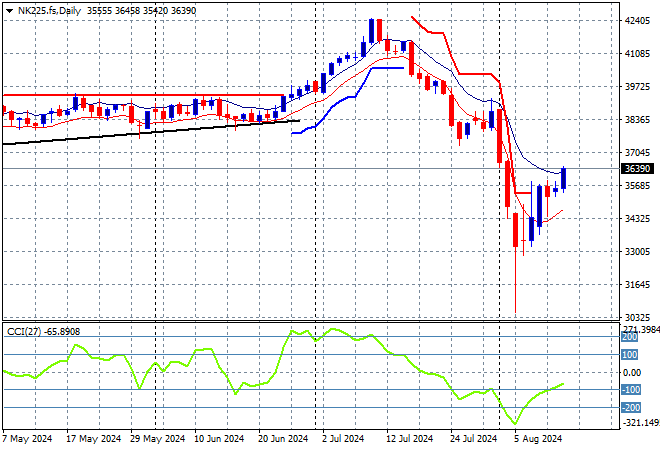
Meanwhile Japanese stock markets returned from their long weekend with the Nikkei 225 soaring more than 3% higher to 36232 points.
Price action had been indicating a rounding top on the daily chart with daily momentum retracing away from overbought readings with the breakout last month above the 40000 point level almost in full remission. Short term support subsequently broke on that retracement, and then the front fell off. Yen volatility may still drag the market around:
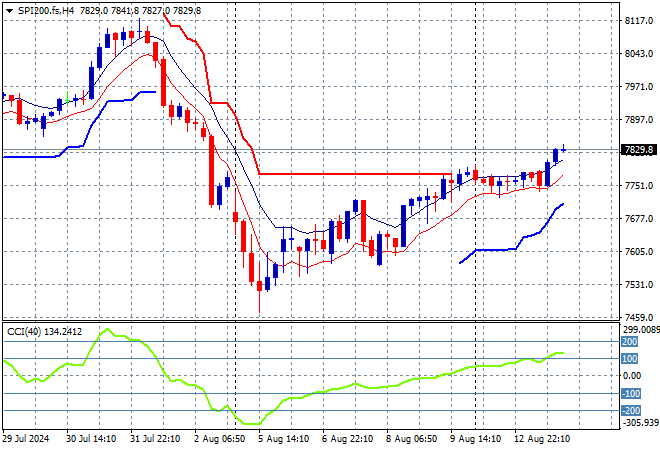
Australian stocks eked out a small gain with the ASX200 lifting just 0.2% gain to close at 7826 points.
SPI futures are up more than 0.7% higher in response to the solod action overnight on Wall Street. Former medium term support at the 7700 point level will remain under pressure here as trader’s absorb the RBA’s signalling of no punchbowl for the rest of 2024, but short term momentum looks more positive:
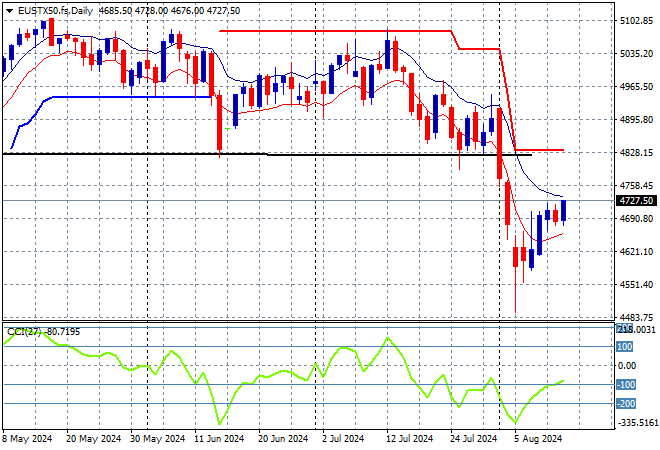
European markets stabilised again but this time put in some solid gains across the continent, as the Eurostoxx 50 Index managed to finish 0.5% higher at 4694 points.
The daily chart shows price action off trend after breaching the early December 4600 point highs with daily momentum retracing well into an oversold phase. This was looking to turn into a larger breakout with support at the 4900 point level quite firm with resistance just unable to breach the 5000 point barrier. Instead, former ATR support at the 4900 point level was only a temporary anchor point as we remain deep down into correction territory. Price must clear the 4700 local resistance level smartly to get out of trouble:
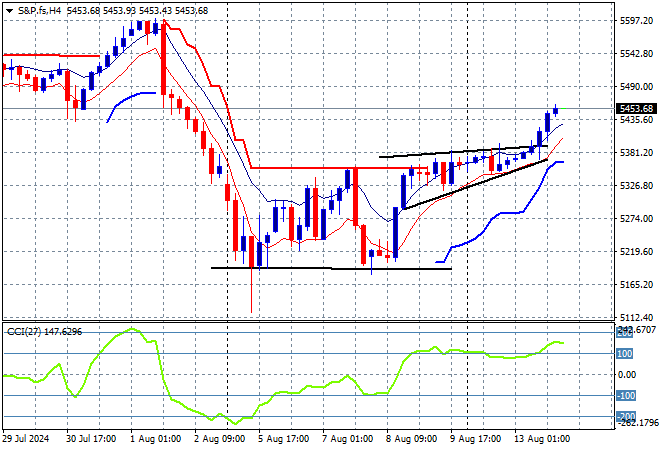
Wall Street was the best performing overnight helped by weaker USD with the NASDAQ lifting more than 2% higher while the S&P500 closed up 1.4% at 5434 points.
The four hourly chart illustrates how this bounceback has now cleared short term resistance at the mid 5300 point level with momentum retracing fully from oversold to very positive. The potential for a positive breakout was building here but can it return to the early August highs:
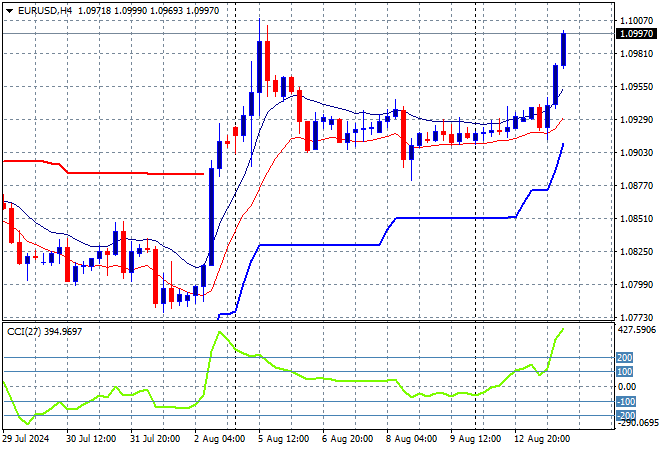
Currency markets finally moved further against USD with most of the majors advancing as pressure gave way, especially with Euro which almost hit the 1.10 handle overnight.
The union currency had previously bottomed out at the 1.07 level before gapping higher earlier in the week with more momentum building to the upside with the 1.0750 mid level as support but there was still too much pressure from King Dollar. This looks much more encouraging but very overbought in the short term:
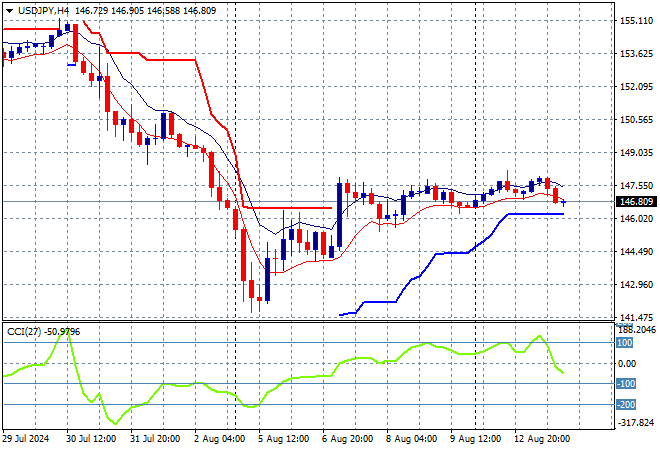
The USDJPY remains on a downwards medium term pattern as the carry trade unwinds as the bounceback is starting to waver at the 147 level with the potential to extend further dissipating as short term momentum slows.
The overall volatility speaks volumes as it pushed aside the 158 level as longer term resistance in the weeks leading up to the BOJ rate hike. Momentum is suggesting a possible bottom is brewing but this maybe just catching knives at this point:
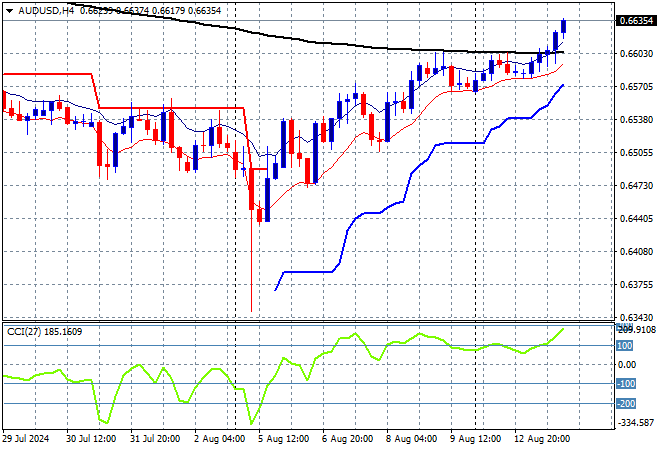
The Australian dollar is finally moving higher as it breaks through the 66 cent level for the first time in weeks overnight, taking advantage of USD weakness.
During June the Pacific Peso hadn’t been able to take advantage of any USD weakness with momentum barely in the positive zone but that has changed in recent weeks with price action finally getting out of the mid 66 cent level that acted as a point of control. My view of a weak resurgence is morphing slowly into a stronger move higher as it clears the 66 cent level:
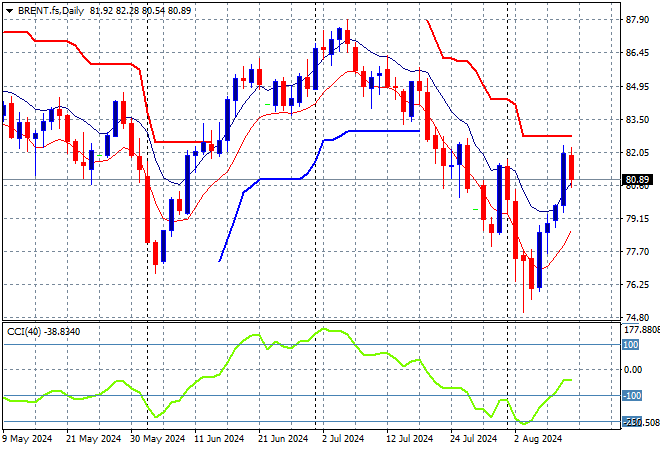
Oil markets are still trying to move out of their previously weak position as the looming Iran/Israel war provides more volatility with Brent crude pushing above the $82USD per barrel level before retracing back to the $80 level overnight.
After breaking out above the $83 level last month, price action had stalled above the $90 level awaiting new breakouts as daily momentum waned and then retraced back to neutral settings. Daily ATR support had been broken with short term momentum still in oversold mode but watch for a potential follow through on this reversal as this swings into higher volatility:
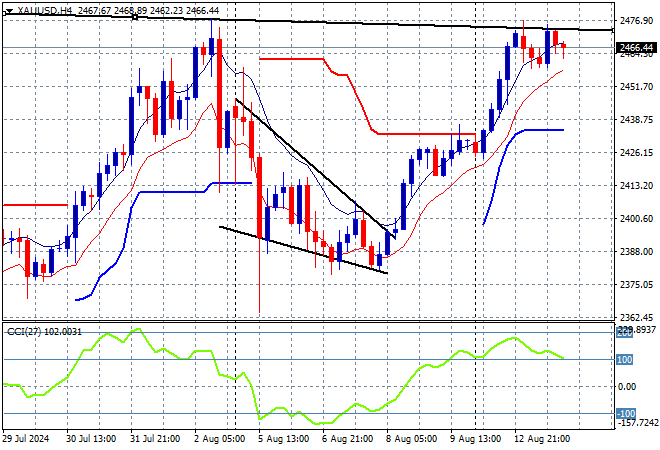
Gold was finding it tough to get back above the $2400USD per ounce level after last week’s volatility but managed to clear short term resistance mid-week and has kept above that level on Friday night as the classic falling bullish wedge pattern performed as expected. Price action overnight kept steady at the $2470 level.
The longer term support at the $2300 level remains firm while short term resistance at the $2470 level remains the target to push through this week:
Glossary of Acronyms and Technical Analysis Terms:
ATR: Average True Range – measures the degree of price volatility averaged over a time period
ATR Support/Resistance: a ratcheting mechanism that follows price below/above a trend, that if breached shows above average volatility
CCI: Commodity Channel Index: a momentum reading that calculates current price away from the statistical mean or “typical” price to indicate overbought (far above the mean) or oversold (far below the mean)
Low/High Moving Average: rolling mean of prices in this case, the low and high for the day/hour which creates a band around the actual price movement
FOMC: Federal Open Market Committee, monthly meeting of Federal Reserve regarding monetary policy (setting interest rates)
DOE: US Department of Energy
Uncle Point: or stop loss point, a level at which you’ve clearly been wrong on your position, so cry uncle and get out/wrong on your position, so cry uncle and get out!