CBA economists Gareth Aird and Stephen Wu estimate that the household savings war chest accumulated over the pandemic will be largely exhausted by the end of 2024.
As a result, “the boost to consumer spending power in 2024/25via the 1 July 2024 tax cuts will be partially offset by the decline of the tailwind on consumption from the savings drawdown, which has taken place since Q4 22”.
This means that household consumption growth will remain below trend until the RBA commences an easing cycle. Consumer confidence will also remain in the doldrums until the RBA starts cutting rates.
CBA has forecast 1.25% of monetary easing, beginning from November 2024; although there is a good chance that easing will be delayed to 2025.
Below is CBA’s full report.
Pandemic savings were extraordinary
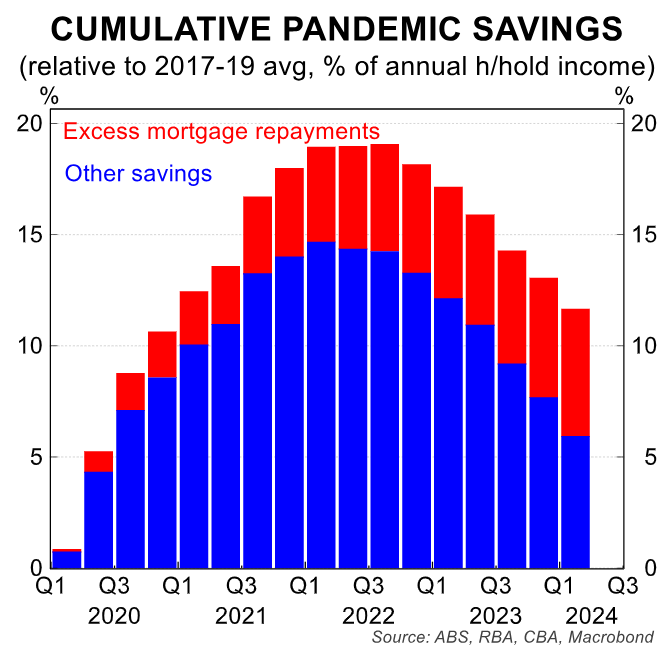
Australian households accrued an extraordinary amount of additional savings during the pandemic period. We put that figure at ~A$300bn (~20% of annual household disposable income), which is in line with RBA estimates.
The stock of excess savings peaked in Q3 22. To gauge the impact on current and future spending from pent-up savings, we are interested the evolution of savings relative to ‘normal’ or trend.
Australian households are generally net savers, as evidenced by a positive savings rate on average over time. As such, total household savings are almost always an upward trend.
The exception to this was in the years leading up to the global financial crisis (GFC). But the economic landscape was very different then.
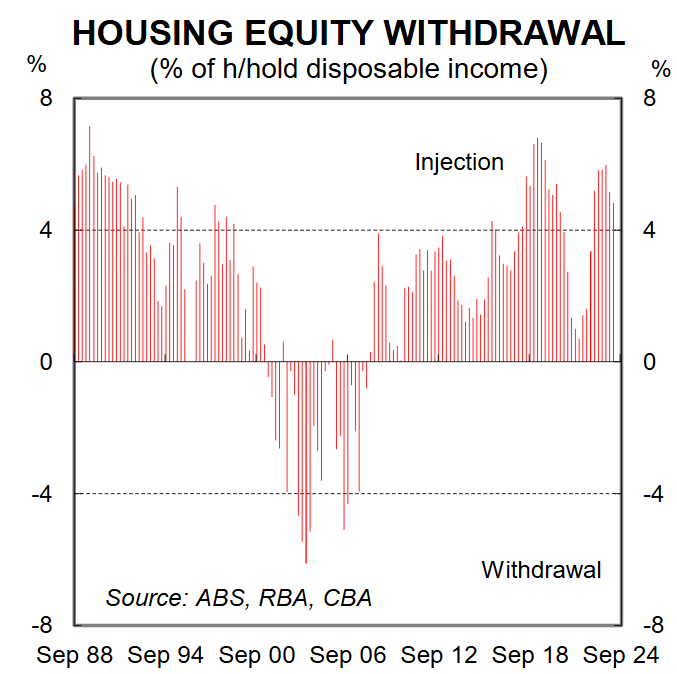
Consumer sentiment was elevated, credit growth was strong, and households were withdrawing equity from the housing stock (i.e. mortgage debt had risen faster than net spending on housing assets).
In contrast, over the past eighteen months consumer confidence has been at levels consistent with a major negative economic shock or recession. Credit growth has been a little softer than income growth. And households have continued to inject equity into the housing stock.
Put simply, the years leading up to the GFC when the savings rate was negative were exceptional. And they were defined by a unique set of circumstances that we are unlikely to see repeated again.
Excess savings drawdown has been underway since late 2022
The flow of savings can be split into two categories: (i) excess mortgage payments into offset and redraw facilities; and (ii) ‘other’, which is the residual.
We calculate that the ~$A300bn of accrued additional savings during the pandemic comprised ~$A80bn of additional payments into mortgage offset and redraw facilities and ~$A220bn of ‘other’ savings.
Since Q3 22 the stock of additional savings accumulated during the pandemic has steadily declined. Over that period the savings rate has averaged 1.6%, which is below its five year pre-pandemic average of 6.1%.
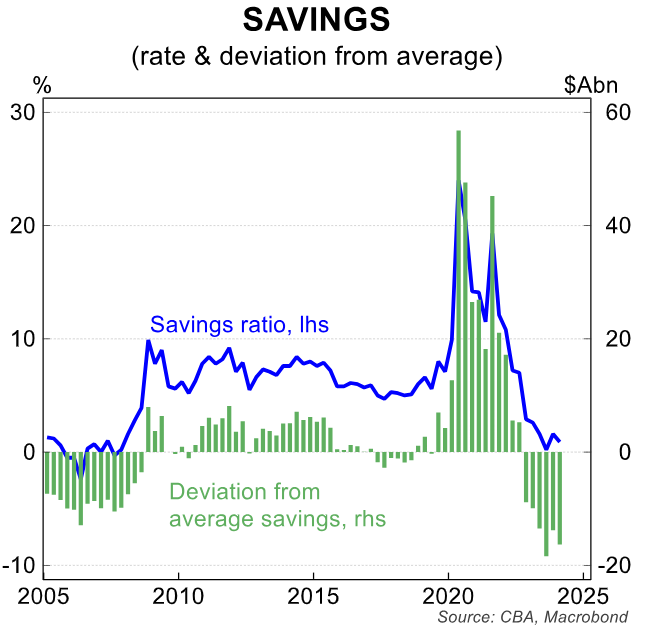
The decline in additional savings has meant that consumer spending for much of the past two years has been supported by a notional savings drawdown. We say notional as overall savings are still growing.
But the savings rate is below average, which implies a drawdown of the additional accumulated savings during the pandemic (note that compulsory superannuation payments are part of household income and are therefore forced savings by the household sector each quarter).
The savings drawdown has partially offset the impact of significantly higher interest rates on household consumption. And it has meant the ‘long and variable’ lags between changes in interest rates and their impact on GDP and employment have been more elongated than usual.
Notwithstanding, real consumer spending per capita has fallen for the past five quarters (latest data to Q1 24). For context, when the savings rate was extraordinarily low/negative in the years prior to the GFC real consumer spending per capita was powering higher (see next chart).
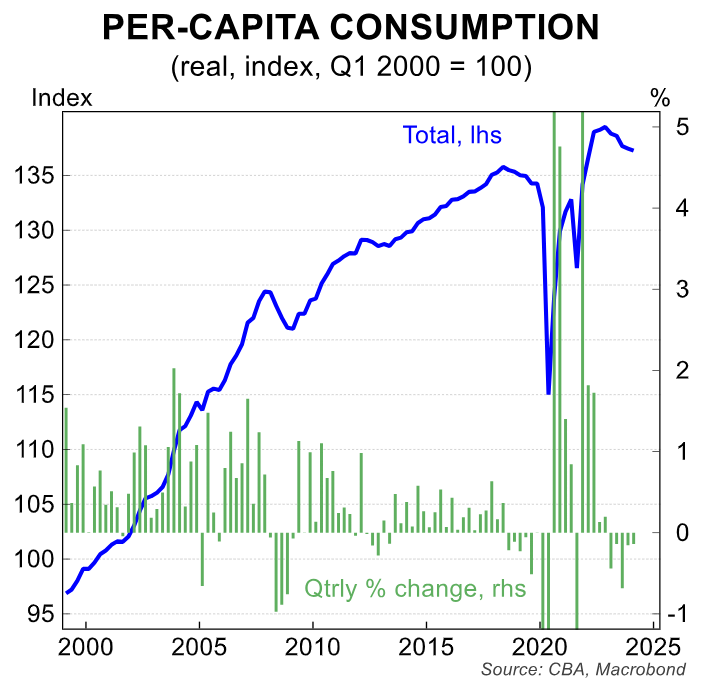
Another decline in real household spending per capita is forecast to have occurred in Q2 24.
How much of the accumulated savings have been drawn down?
We estimate that ~$A140bn of ‘other’ savings have been drawn down (i.e. spent) as at Q1 24. This leaves $A80bn of ‘other’ savings left.
In contrast, excess payments into offset and redraw facilities have continued to climb since the savings drawdown started.
Based on our forecasts for household income and consumption over 2024, the stock of ‘other’ excess savings accumulated over the pandemic will continue to decline until it is essentially exhausted by the end of 2024.
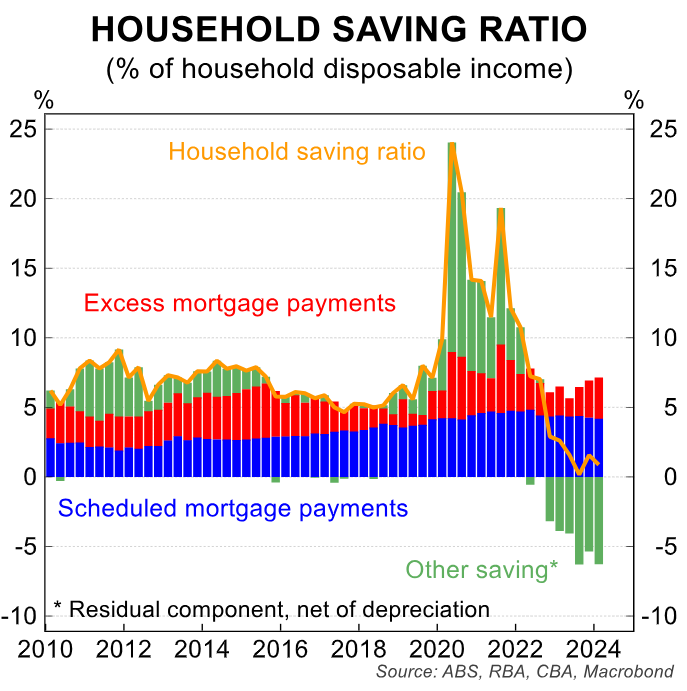
This means that the tailwind of the savings drawdown on household consumption should have run its course by the beginning of 2025.
There is, of course, still a large stock of excess additional savings accrued during the pandemic sitting in mortgage offset and redraw facilities. But the evidence to date indicates that households, as a collective, do not want to drill down on these savings.
Indeed, households are still adding to redraw and offset accounts. This is a dynamic we anticipated.
The large increase in the average outstanding mortgage rate due to RBA interest rate hikes increases the incentive for households to preserve buffers built up in offset and redraw facilities.
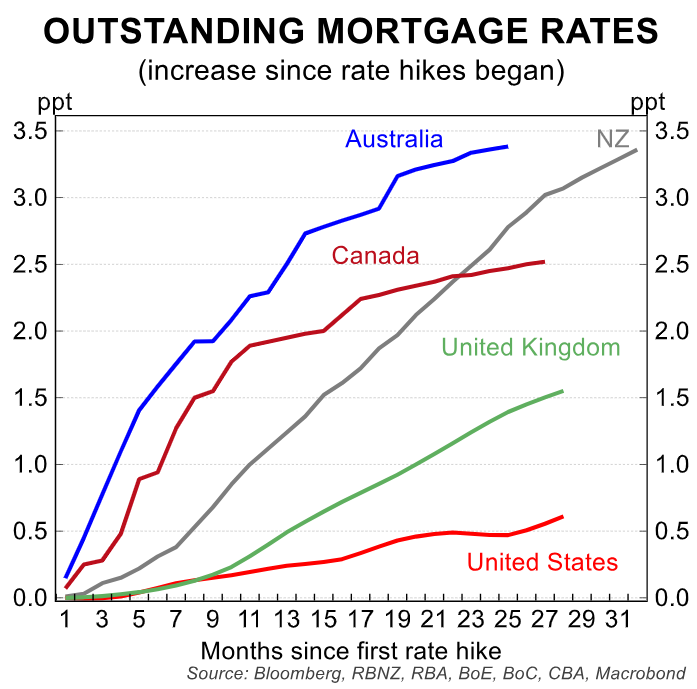
The opportunity cost of spending money in offset and redraw facilities is the tax-adjusted return derived from the mortgage rate.
The higher the mortgage rate, the greater the incentive households with mortgage buffers have to save rather than spend.
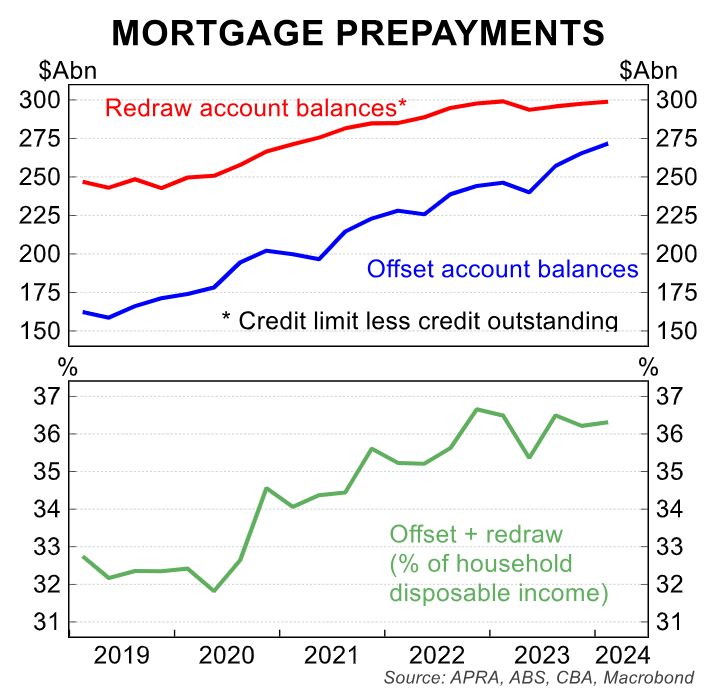
The increase in money going into offset and redraw facilities is a positive dynamic for financial stability. It means that many households have some wriggle room if they were to get into financial difficulty, particularly given the unemployment rate is forecast to continue to lift (CBA forecast an end 2024 unemployment rate of 4.5%, up from the June level of 4.1%).
But overall we do not factor in any drawdown of money sitting in mortgage offset and redraw facilities in our forecast profile for household consumption.
Tax cuts and household consumption
Real household disposable income receives a boost over 2024/25 due to the Stage 3 tax cuts (worth ~0.8% of GDP). This will provide a tailwind on consumer spending over the current fiscal year.
But the tax cuts have kicked in as the tailwind of the excess pandemic savings drawdown has around six months to run. As such, we expect the impact of tax cuts to be more muted than otherwise on consumer spending.
If we are correct, the savings rate will drift higher in 2024/25 compared to 2023/24. Indeed, that is our expectation and we forecast the savings rate to edge up.
The RBA’s policy decisions will of course have a large bearing on spending outcomes from here. Growth in consumer spending will lift if the RBA embarks on an easing cycle, as we anticipate to commence in November. This risk sits with a later start date for rate cuts.
Lower interest rates will boost household disposable income and therefore purchasing power will rise. And lower interest rates will also propel consumer sentiment higher, which will give households greater confidence to spend.
The outlook for lower interest rates in Australia, however, looks less assured than it does in other jurisdictions presently.
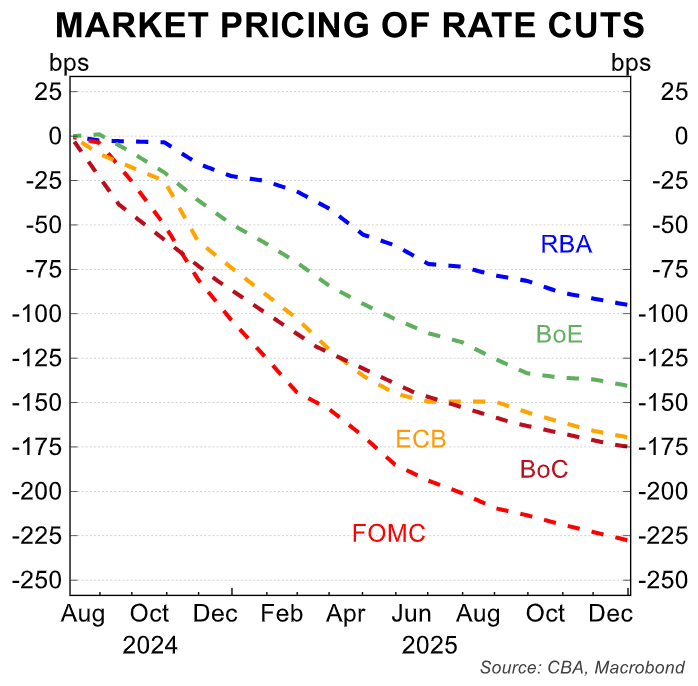
The money markets have priced a lot more in the way of rate cuts in the US, UK, Eurozone and Canada than they have in Australia. And the RBA has recently pushed back on the idea of near term interest rate relief.
Our overall message is that we believe rate relief is required to generate a meaningful lift in consumer spending that would propel GDP growth to a trend-like pace. And trend-like economic growth will be needed to keep the unemployment rate from rising further in 2025.
The RBA’s desire to stay on the narrow path is about restoring price stability whilst maintaining full employment.
We believe monetary policy will need to slowly move away from its restrictive setting in the not too distant future if full employment is to be retained.
Monetary policy operates with a lag in both directions. And both unemployment and inflation are lagging indicators.
The economic outlook is finely poised at the moment. Public demand is strong. But private demand growth is incredibly weak.
The tailwind of the savings drawdown, which has so far kept spending growth higher than otherwise, doesn’t have too much further to run.
As such, we believe the RBA’s forecasts for real household consumption to lift to 2.1%/yr in Q2 25 and 2.8%/yr in Q4 25 from the August Statement on Monetary Policy are too optimistic.
Our assessment is that the RBA has under appreciated the impact that the savings drawdown has played in supporting household consumption since the economy reopened.
As a result, we believe the RBA is overestimating the extent to which Stage 3 tax cuts will push spending higher given the savings drawdown will be essentially over by the end of the year.

