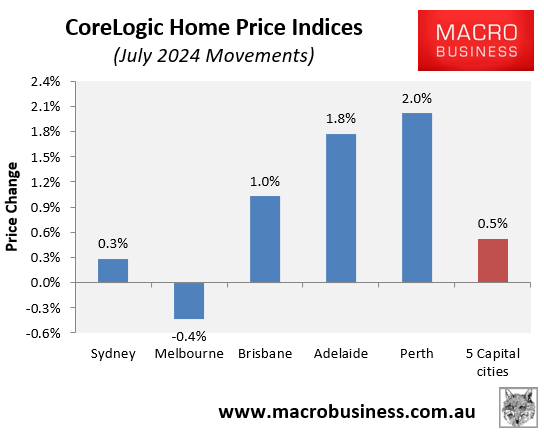
CoreLogic’s daily dwelling values index shows that values across the five major capital city markets grew by 0.5% in July.
As shown in the following chart, there was a strong divergence between the two largest capital cities—Sydney (0.2%) and Melbourne (-0.4%)—compared to the other major markets:
The next chart plots values on a 28-day rolling basis across the five capital city markets:
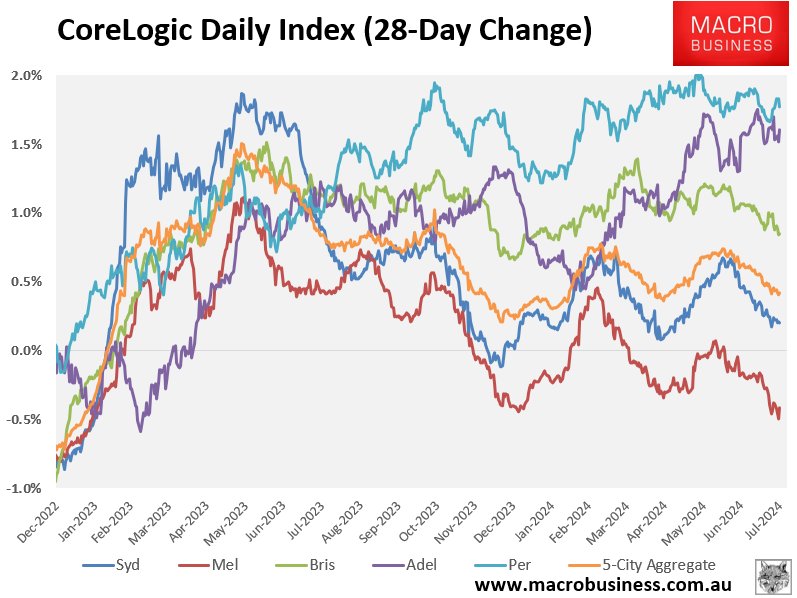
As you can see, Sydney and Melbourne have lost momentum, which has pulled down the 5-city aggregate index, whereas the other major capitals continue to grow at a swift pace.
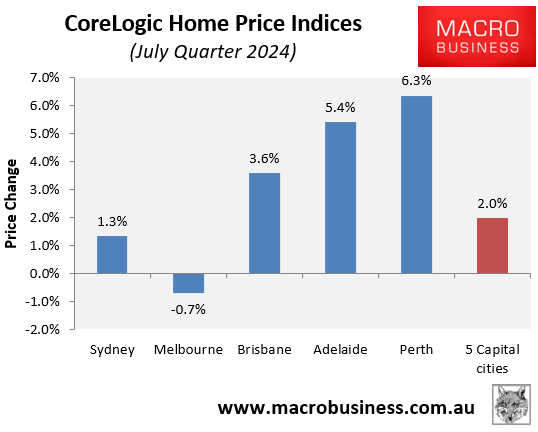
The story is the same on a quarterly basis, with Sydney recording a modest rise of 1.3%, Melbourne recording a decline of 0.7%, and the other major capitals recording strong growth:
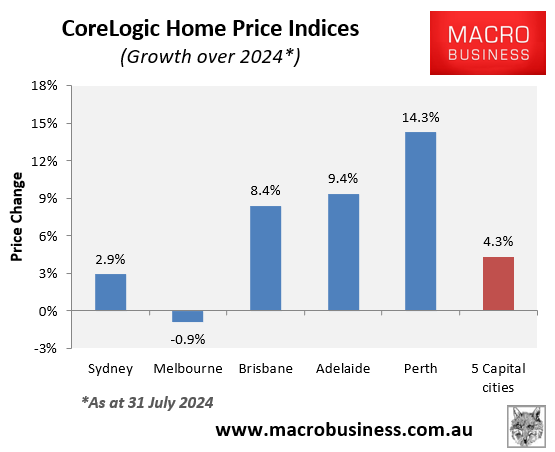
Since the beginning of the year, dwelling values have risen by 4.3% at the 5-city aggregate level, again driven by strong growth across Perth, Adelaide, and Brisbane:
Finally, dwelling values at the 5-city aggregate level have grown by 15.4% since bottoming on 29 January 2023, led by extreme growth in Perth (32.5%) and strong growth in Brisbane (22.5%) and Adelaide (19.7%):
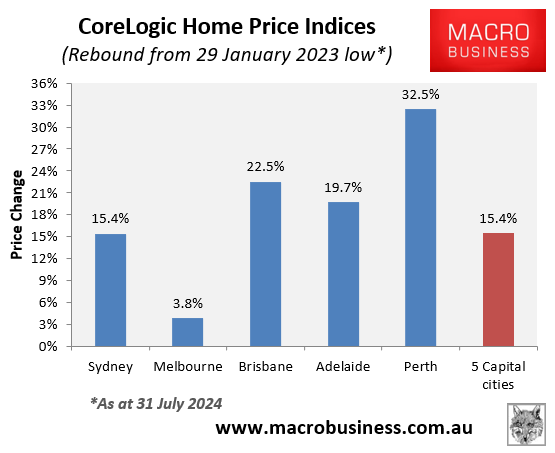
At the other end of the spectrum, Melbourne dwelling values have increased by only 3.8% over the same time period.
Later this morning, the Australian Bureau of Statistics will release the Q2 CPI inflation data, which will determine whether the Reserve Bank of Australia (RBA) lifts interest rates at its meeting next Tuesday.
The outcome of this CPI release and the next meeting of the RBA will obviously have a major impact on the trajectory of Australian home prices.
