
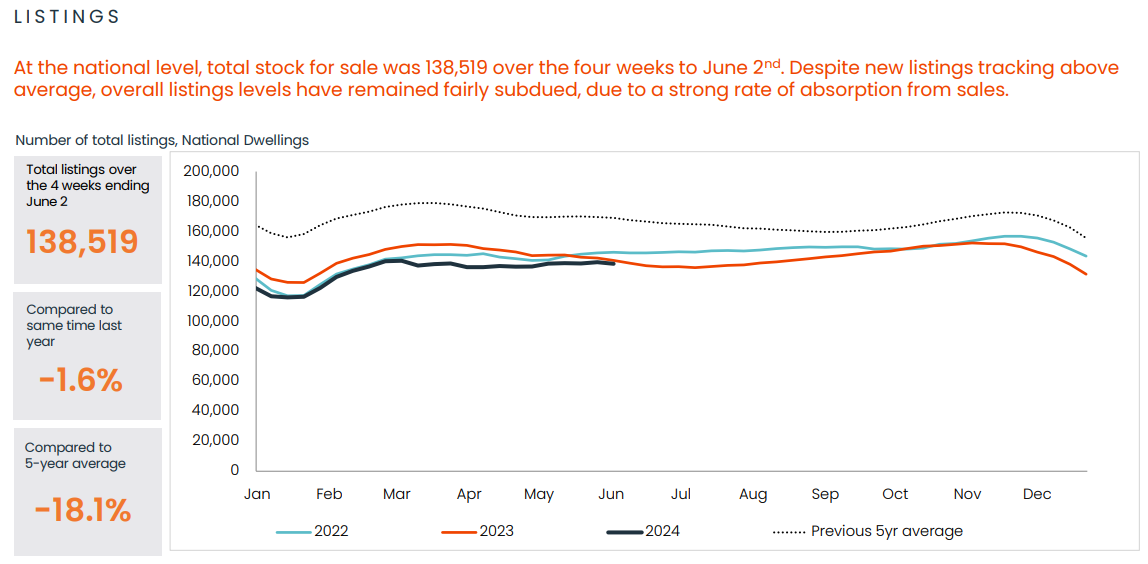
CoreLogic’s monthly chart pack has been released and shows that the number of homes listed for sale across Australia remains historically low, tracking 1.6% below the same period last year and 18.1% below the five year average:
Source: CoreLogic
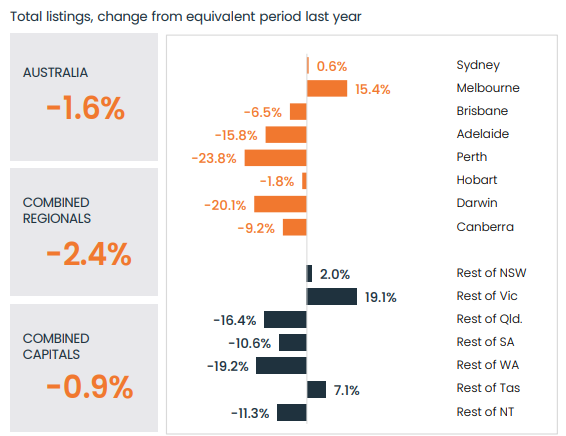
The following chart demonstrates that the major states of Victoria (Melbourne) and NSW (Sydney) have been responsible for the decline in listings, whereas the other mainland states have seen solid to significant declines in listings:
Source: CoreLogic
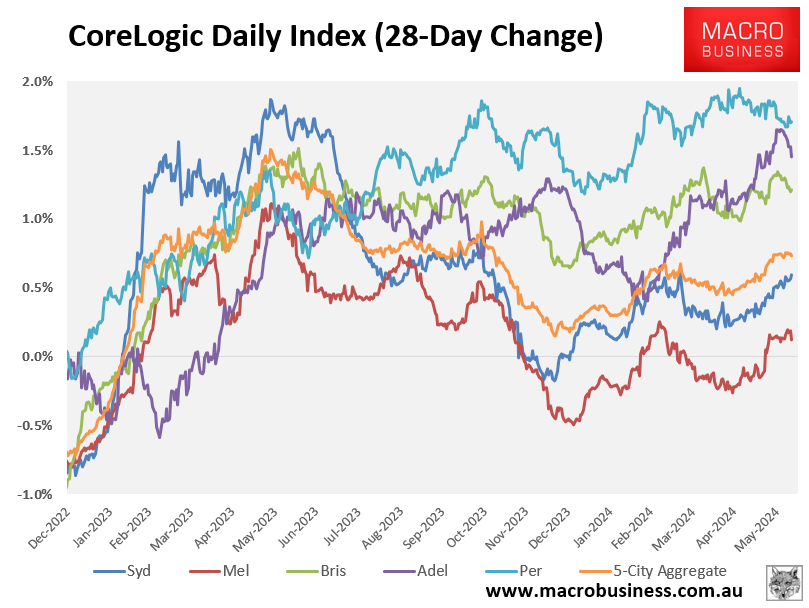
The next chart shows that CoreLogic’s daily house price index has strengthened over the past month, with the smaller major capitals driving the growth:
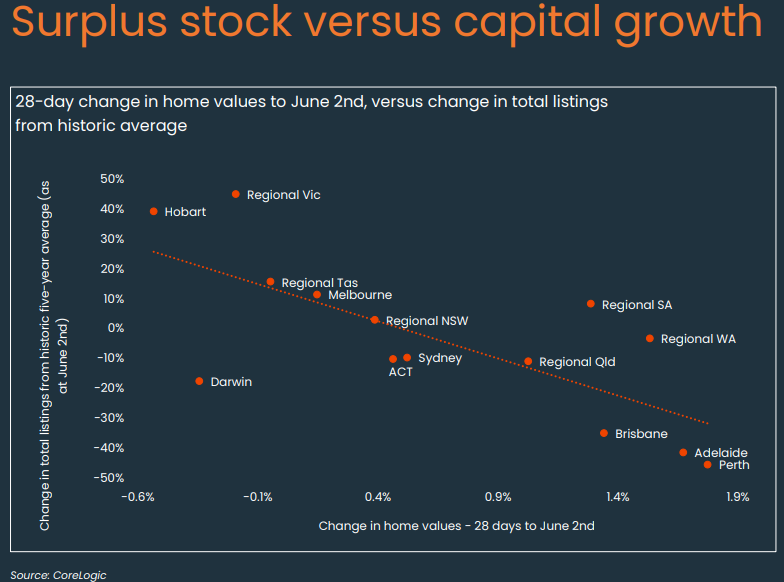
According to Eliza Owen at CoreLogic, the supply-demand dynamics across each market help to explain a lot of the variation in price growth:
Source: CoreLogic
“Areas with above-average stock, like Tasmania and Victoria, tend to have an over-supply of housing relative to demand for purchases, creating a buyer’s market and putting downward pressure on prices”, Owen said.
“Tighter supply levels across Brisbane, Adelaide and Perth continue to drive strong growth”.
“At one end of the spectrum is Perth, with total listings sitting 45% below average stock levels, and a monthly capital growth rate of 1.8%”.
“At the other end of the spectrum, the additional choice in stock across areas like Victoria and Tasmania means vendors have to bring down their price expectations, and that brings values down”, Owen said.
Australia is currently experiencing dual shortages of housing supply: a lack of homes for sale and a lack of homes under construction.
As a result, both home values and rents continue to appreciate.
