
Wall Street fell again overnight, led by tech stocks while European shares put in a modest rebound with the latest US GDP and initial jobless numbers coming in as expected. The USD fell back against most of the majors but gathered some ground later in the session this morning. The Australian dollar actually bounced the hardest after hitting a two week low, and is currently just at the mid 66 cent level.
10 year Treasury yields reversed course and lost nearly 7 points to retrace below the 4.6% level while oil prices suffered further despite more OPEC assurances with Brent crude falling back below the $82USD per barrel level. Gold had another volatile session as it eventually finished around the $2340USD per ounce level.
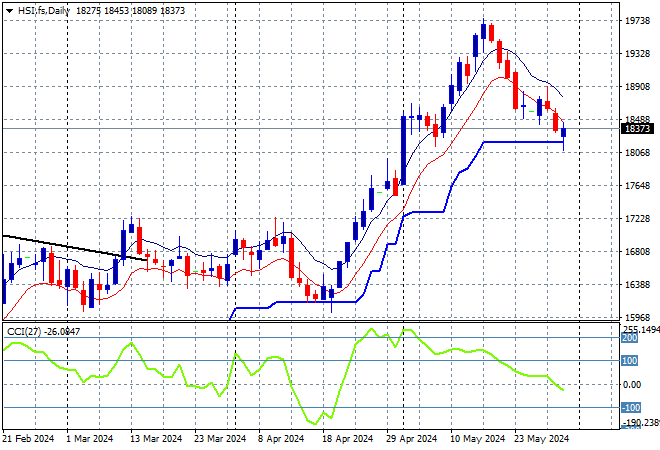
Looking at markets from yesterday’s session in Asia, where mainland Chinese share markets were again up initially but gave up their gains and then more towards at the close with the Shanghai Composite off by 0.6% while the Hang Seng Index lost over 1% to 18239 points.
The Hang Seng Index daily chart was starting to look more optimistic with price action bunching up at the 16000 point level before breaking out in the previous session as it tried to make a run for the end of 2023 highs at 17000 points with the downtrend line broken. Price action was looking way overextended but this retracement is now taking some heat out of the market but needs to stop soon before moving into corrective mode:
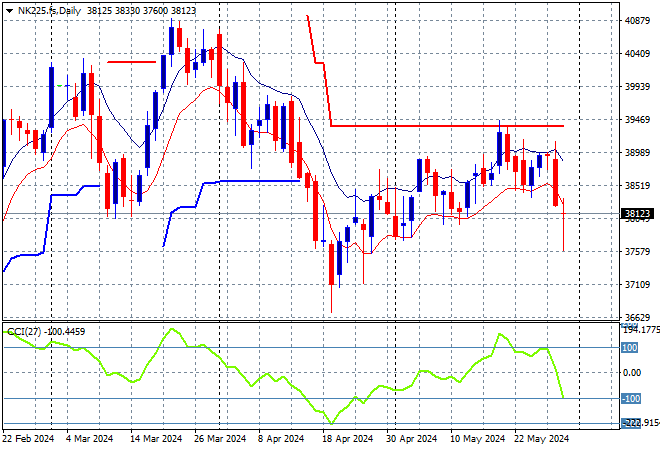
Meanwhile Japanese stock markets are speeding up their losses with the Nikkei 225 putting in a 0.9% loss to 38056 points.
Price action had been indicating a rounding top on the daily chart with daily momentum retracing away from overbought readings with the breakout last month above the 40000 point level almost in full remission. Short term resistance had been defended with short term price action now rebounding off former support at the 39000 point level with short term momentum no longer indicating a potential breakout, with futures retracing heavily:
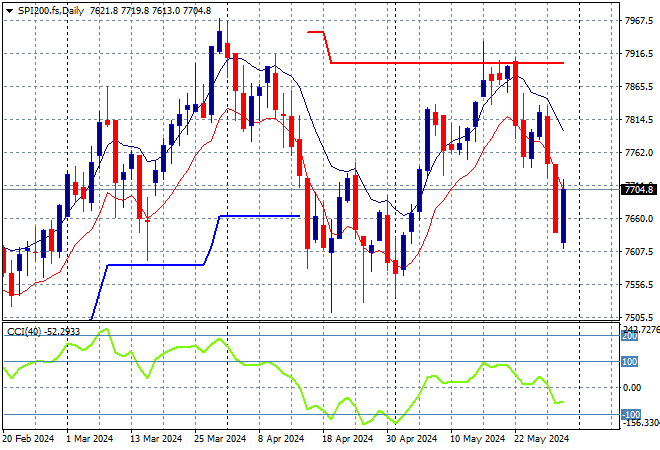
Australian stocks was the best performer relatively speaking, with the ASX200 down 0.5% to 7628 points.
SPI futures are up nearly 0.7% despite the selloff on tech stocks on Wall Street overnight. The daily chart was showing a potential bearish head and shoulders pattern forming with ATR daily support tentatively broken, taking price action back to the February support levels. Momentum was finally getting out of its oversold condition but it looks like any potential upside is sliding back again:
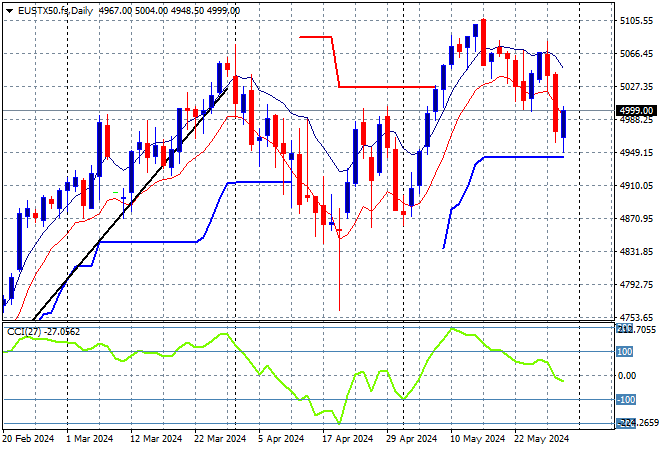
European markets paused their recent reversal with some rebounds across the continent with the Eurostoxx 50 Index closing some 0.4% higher to 4982 points.
The daily chart shows price action off trend after breaching the early December 4600 point highs with daily momentum retracing well into an oversold phase. This is still looking to turn into a larger breakout with support at the 4900 point level quite firm but resistance has proven too strong overhead:
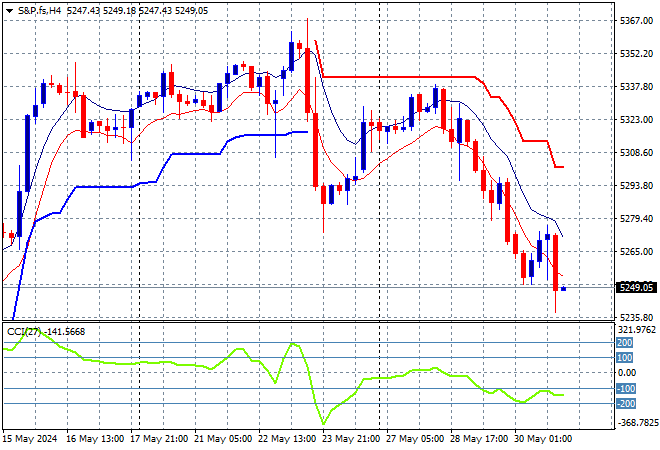
Wall Street was dragged down by tech stocks, with the NASDAQ losing more than 1% or so while the S&P500 fell another 0.6% extending its losses below the 5300 point level, finishing at 5235 points.
The daily chart was showing a large move higher as all Fed roadblocks seemingly were cleared with price action getting well out of its previous slightly stalled position above the 5200 point area. However the four hourly chart was showing a lot of hesitation here at the 5300 point level as short term momentum reverted and is now well oversold for a two week low:
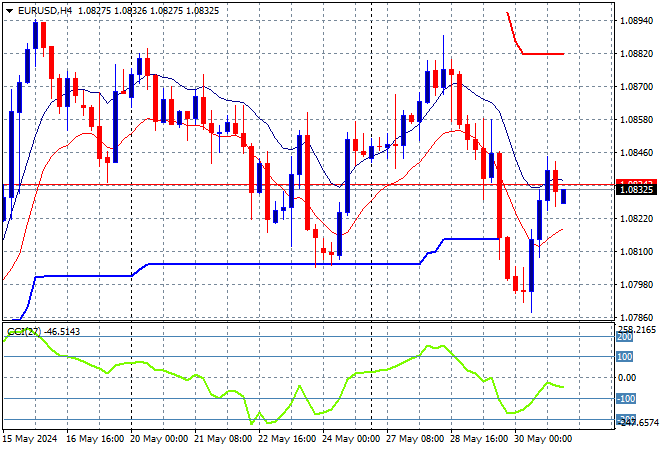
Currency markets were witnessing a much firmer USD but internal markers in the latest US GDP print and comments from Fed and SNB officials saw King Dollar lose ground initially throughout the session, with Euro rebounding well above the 1.08 handle proper.
The union currency had previously bottomed out at the 1.07 level at the start of April as medium term price action with a reprieving reversal in price action back towards the 1.09 level before its own inflation print. Medium term support at the 1.0630 level has been respected but short term support has been broken here at the 1.08 level with momentum still quite negative:
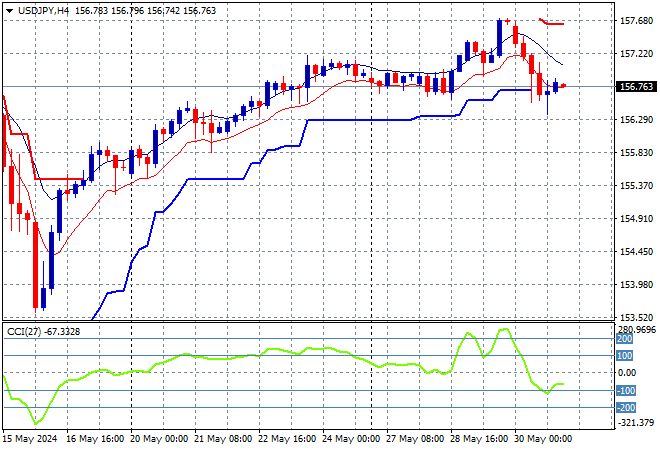
The USDJPY pair was unable to advance further from its new weekly high in the previous session and has steadied somewhat just below the 157 level after looking positive before the recent consumer confidence print.
This price action post the epic BOJ meeting volatility was much more welcome but this reversal is not that surprising given the weakness of the USD. ATR support at the mid 156 handle continues to be defended but only just as short term momentum inverts:
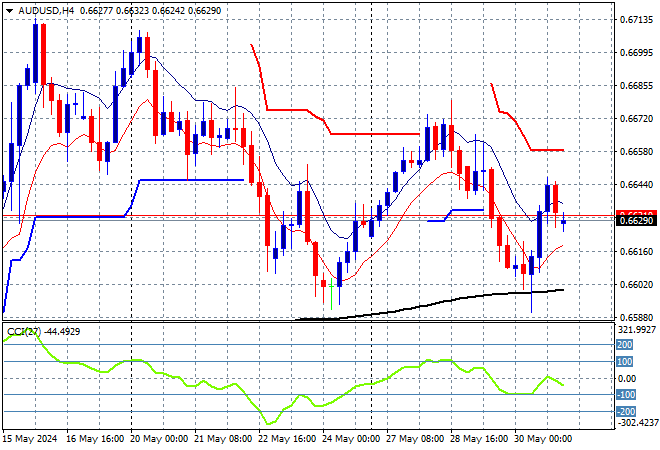
The Australian dollar has been in whipsaw mode for over a week now and this time bounced back on temporary USD weakness, heading back up through the 66 handle before losing some short term momentum this morning.
The Aussie has been under medium and long term pressure for sometime before the recent RBA and Fed meetings and while there was optimism in the last couple of weeks, resistance at 67 cents was too high to breach. I still reckon the 66 handle will break soon as successive levels of resistance continue to ramp down:
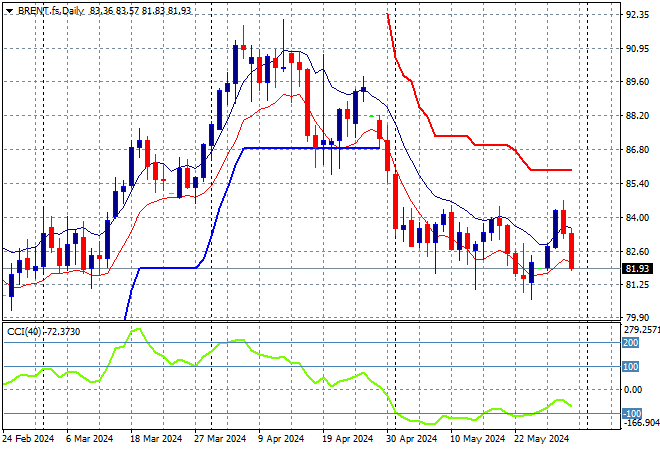
Oil markets are failing to get back on track as the trend remains down since the late March highs with Brent crude unable to make good on its recent breakout, retracing below the $82USD per barrel level overnight.
After breaking out above the $83 level last month, price action has stalled above the $90 level awaiting new breakouts as daily momentum waned and then retraced back to neutral settings. Watch daily ATR support here at the $86 level which is still broken and will likely be resistance for sometime:
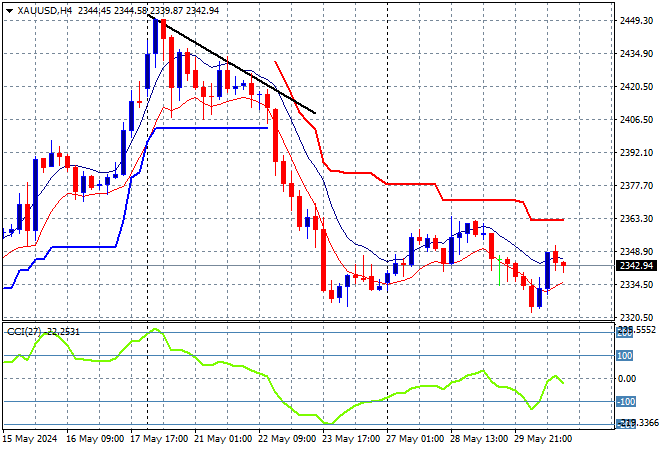
Gold is still failing to get back on trend as well as the USD mood remains too strong with a small bounceback overnight towards the $2350USD per ounce level that is already losing momentum.
Short term momentum has retraced out of oversold mode but remains negative with the target to reach in this rebound at trailing short term ATR resistance at the $2380 level looking a bit of a stretch so far:
Glossary of Acronyms and Technical Analysis Terms:
ATR: Average True Range – measures the degree of price volatility averaged over a time period
ATR Support/Resistance: a ratcheting mechanism that follows price below/above a trend, that if breached shows above average volatility
CCI: Commodity Channel Index: a momentum reading that calculates current price away from the statistical mean or “typical” price to indicate overbought (far above the mean) or oversold (far below the mean)
Low/High Moving Average: rolling mean of prices in this case, the low and high for the day/hour which creates a band around the actual price movement
FOMC: Federal Open Market Committee, monthly meeting of Federal Reserve regarding monetary policy (setting interest rates)
DOE: US Department of Energy
Uncle Point: or stop loss point, a level at which you’ve clearly been wrong on your position, so cry uncle and get out/wrong on your position, so cry uncle and get out!