
US markets rebounded on late tech earnings and an expected lift in factory orders, with European shares returning from their mid week holiday under the fear that a June ECB rate cut may not be on the cards. The USD remains somewhat muted with Euro and Pound Sterling lifting overnight while the recent interventions in Yen are now seeing volatility to the downside. Meanwhile the Australian dollar has strengthened above the 65 cent level, almost making a new weekly high.
10 year Treasury yields moved lower again, this time just below the 4.6% level, while oil prices tried to stabilise as Brent crude remains at the $83USD per barrel level. Meanwhile gold has been unable to capitalise on its recent rebound as it struggles to maintain above the $2300USD per ounce level.
Looking at markets from yesterday’s session in Asia, where mainland and offshore Chinese share markets were closed with only the Hang Seng Index reopening today.
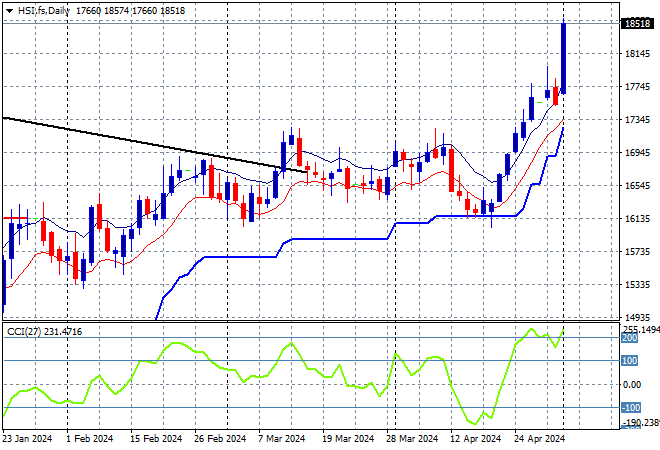
The Hang Seng Index daily chart was starting to look more optimistic with price action bunching up at the 16000 point level before breaking out in the previous session as it tried to make a run for the end of 2023 highs at 17000 points with the downtrend line broken. Price action looks way overextended here so I expect a small retracement back to the 17000 point level, but futures look very optimistic indeed:
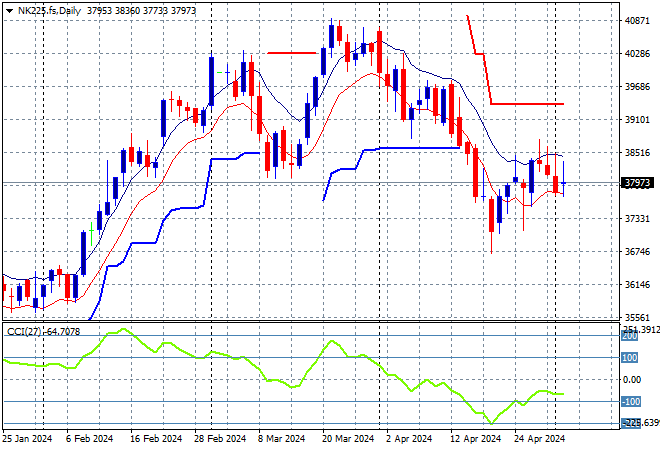
Japanese stock markets slipped back again with the Nikkei 225 down 0.1% to 38236 points.
Price action had been indicating a rounding top on the daily chart with daily momentum retracing away from overbought readings with the breakout last month above the 40000 point level almost in full remission. Short term resistance has been defended with short term price action now retracing to support at the 39000 point level. Watch the 38000 level for signs of a true breakdown:
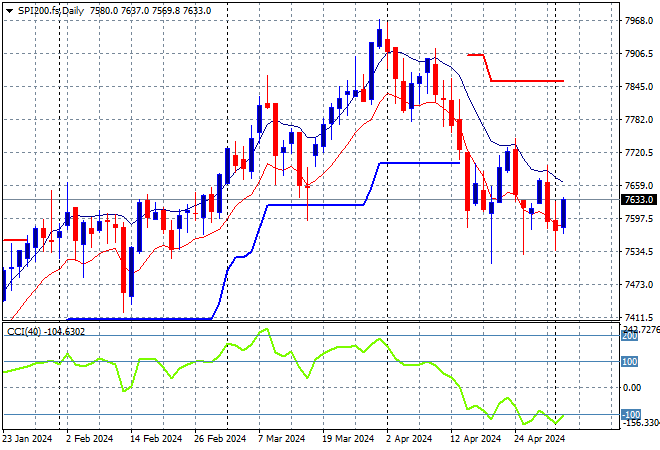
Australian stocks were the best performers but it’s all relative with the ASX200 closing just 0.2% higher at 7587 points.
SPI futures are up 0.5% on the rebound on Wall Street overnight. The daily chart shows a potential bearish head and shoulders pattern forming with ATR daily support now broken, taking price action back to the February support levels. Notably momentum is failing to get out of its oversold condition which is setting up for more downside:
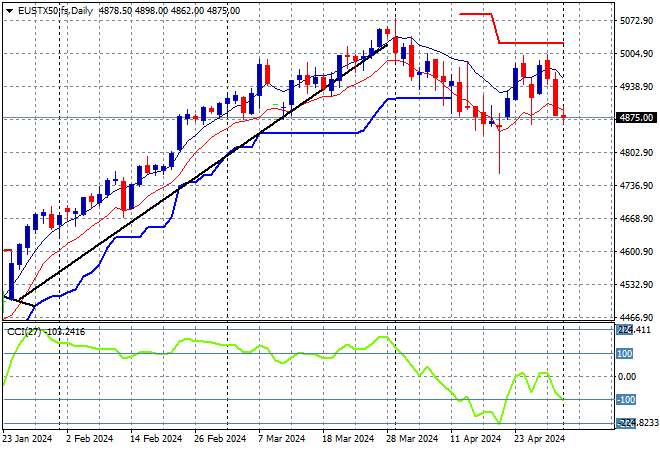
European markets reopened after their Labour Day holiday with further wobbles as the Eurostoxx 50 Index finished down 0.6% to close at 4890 points.
The daily chart shows price action off trend after breaching the early December 4600 point highs with daily momentum retracing well into an oversold phase. This was looking to turn into a larger breakout but this retracement below short term support is likely to turn into a larger reversal with a clear break of support at the 4900 point level:
Wall Street finally found some mojo via tech stocks and late upside earnings with the NASDAQ gaining more than 1.5% while the S&P500 lifted nearly 1%, closing at 5061 points.
The four hourly chart was showing a fairly wide trend channel forming after bottoming out at support at 5000 points but lost significant momentum following Friday’s rebound, and thus a full retracement through trailing ATR support at the 5100 point level. Watch overhead short term resistance at the 5100 area very closely next:

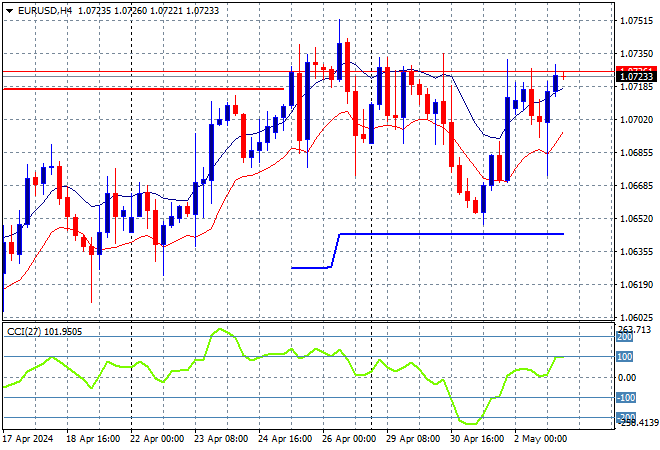
Currency markets in the main remained resilient against USD overnight with Euro rebounding back to the top range it was in prior to the FOMC meeting last week, settling just above the 1.07 handle this morning.
The union currency had previously bottomed out at the 1.07 level at the start of April as medium term price action with a reprieving reversal in price action back towards the 1.09 level before last week’s inflation print. Short to medium term support at the 1.0630 level has been respected so far:
The USDJPY pair is having a wild ride, now this time to the downside with a big drop overnight after a failed move higher, pushed to a new weekly low just below the 154 handle.
This is not looking good in the short term for a lot of traders but looking through the volatility I thought we’d see some stability return around the 155 handle but not yet: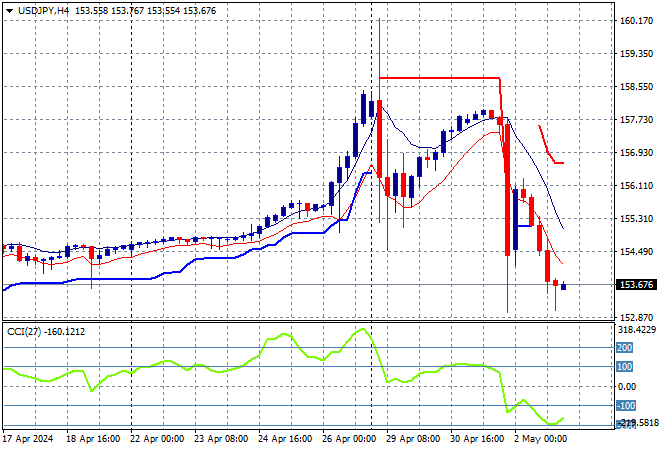
The Australian dollar is still pushing ahead as inflation fears in the US overshadowing ones locally with the Pacific Peso able to remain above the 65 cent handle, almost matching its previous weekly high.
The Aussie has been under medium and long term pressure for sometime before the RBA and Fed meetings and while the previous temporary surge looked strong, it wasn’t overbought on the four hourly chart and had not surpassed support from last week’s consolidation phase. With short term support respected here it still has some road to climb before getting back to the near 66 level from last week:

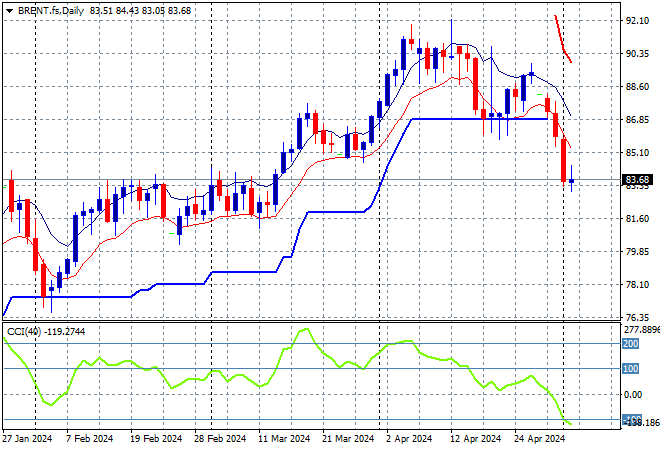
Oil markets have seen increasing intrasession volatility after topping out during the latest round of Middle East conflicts with downside volatility pausing overnight as Brent crude remains just below the $84USD per barrel level.
After breaking out above the $83 level last month, price action has stalled above the $90 level awaiting new breakouts as daily momentum waned and then retraced back to neutral settings. Watch daily ATR here carefully which is now broken:
Gold failed to get back on trend after the minor retracement earlier in the month with what looked like a complete rollover down through the $2300 level and is still depressed here at just above that level last night.
Notably however that is not enough to get over shorter term ATR resistance or indeed the late April highs at the $2350 level with momentum marginally neutral here:

Glossary of Acronyms and Technical Analysis Terms:
ATR: Average True Range – measures the degree of price volatility averaged over a time period
ATR Support/Resistance: a ratcheting mechanism that follows price below/above a trend, that if breached shows above average volatility
CCI: Commodity Channel Index: a momentum reading that calculates current price away from the statistical mean or “typical” price to indicate overbought (far above the mean) or oversold (far below the mean)
Low/High Moving Average: rolling mean of prices in this case, the low and high for the day/hour which creates a band around the actual price movement
FOMC: Federal Open Market Committee, monthly meeting of Federal Reserve regarding monetary policy (setting interest rates)
DOE: US Department of Energy
Uncle Point: or stop loss point, a level at which you’ve clearly been wrong on your position, so cry uncle and get out/wrong on your position, so cry uncle and get out!