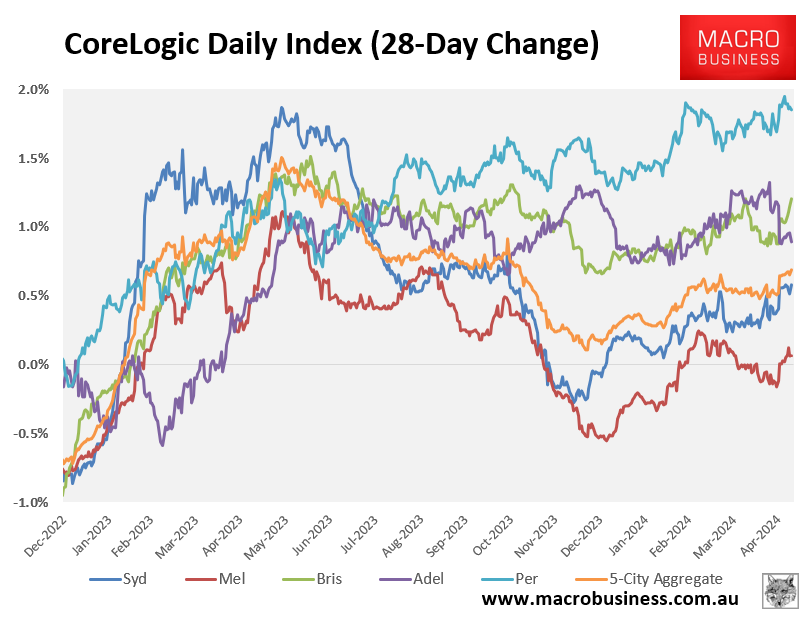
CoreLogic’s daily dwelling index shows that Melbourne home values are lagging the nation, rising only 0.1% over the past 28-days, versus 0.7% growth at the 5-city aggregate level:
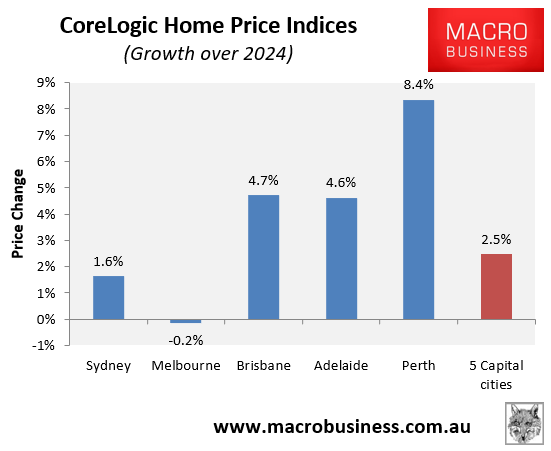
Since the beginning of the year, Melbourne home values have fallen by 0.2%, versus 2.5% growth at the 5-city aggregate level:
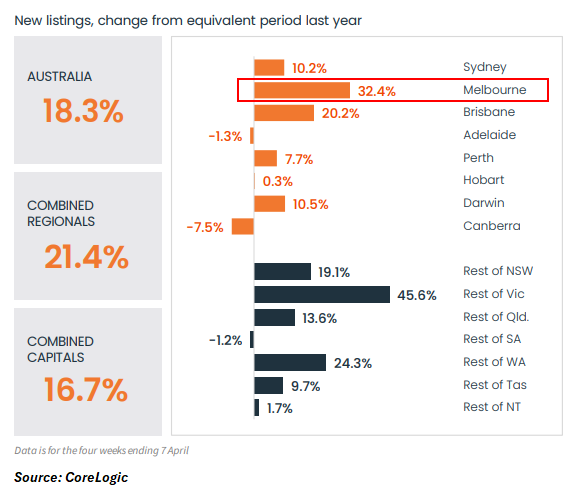
CoreLogic’s monthly chart pack has been released and provides key insight into why Melbourne home values are lagging.
As illustrated in the following chart, new listings in Melbourne increased by 32.4% in the year to 7 April, easily outpacing the other capital city markets:
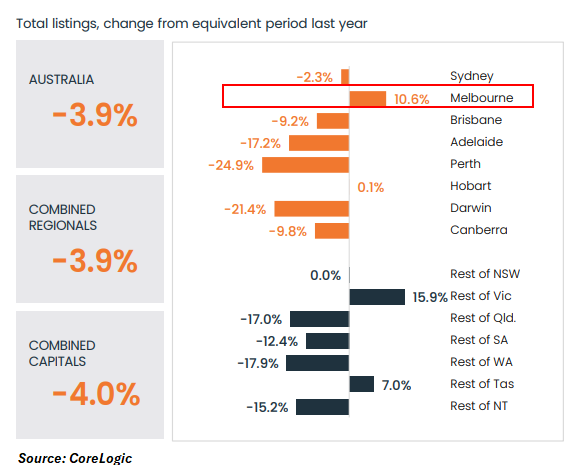
Total listings in Melbourne also increased by 10.6% over the year to 7 April, whereas listing numbers shrank across all other mainland markets:
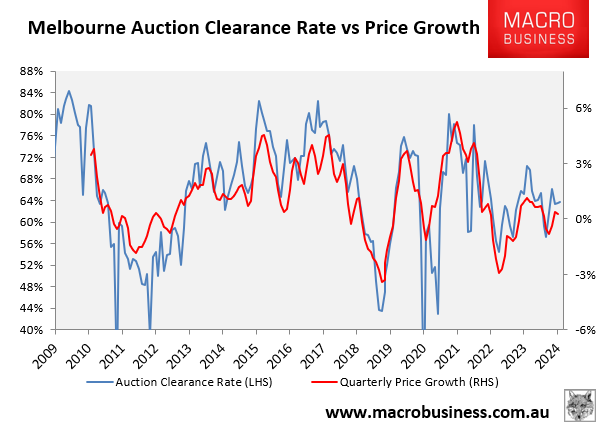
Melbourne’s auction clearance rates have also fallen this year across Melbourne, which is helping to drag down dwelling values:
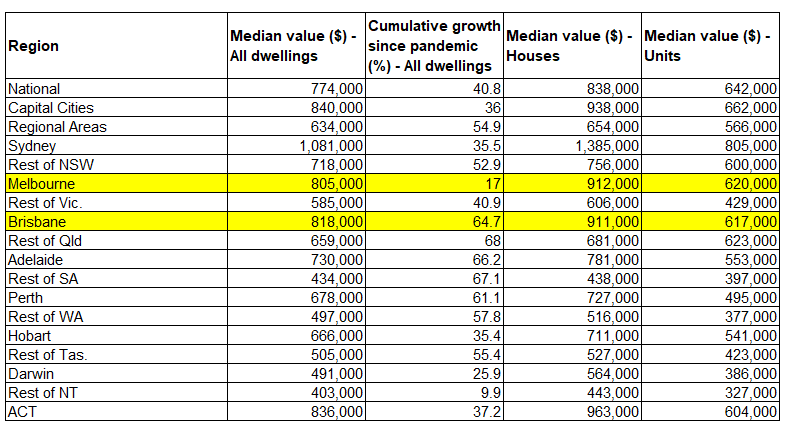
Melbourne’s softer price growth has already seen its median price being overtaken by Brisbane:
Source: PropTrack
Brisbane’s price outperformance will see its median value gap widen with Melbourne this year.
