
The Productivity Commission (PC) has released a snapshot of inequality in Australia.
Two charts are especially interesting.
The first chart, presented below, shows that Australian wealth is overwhelmingly tied up in residential property, followed by superannuation:
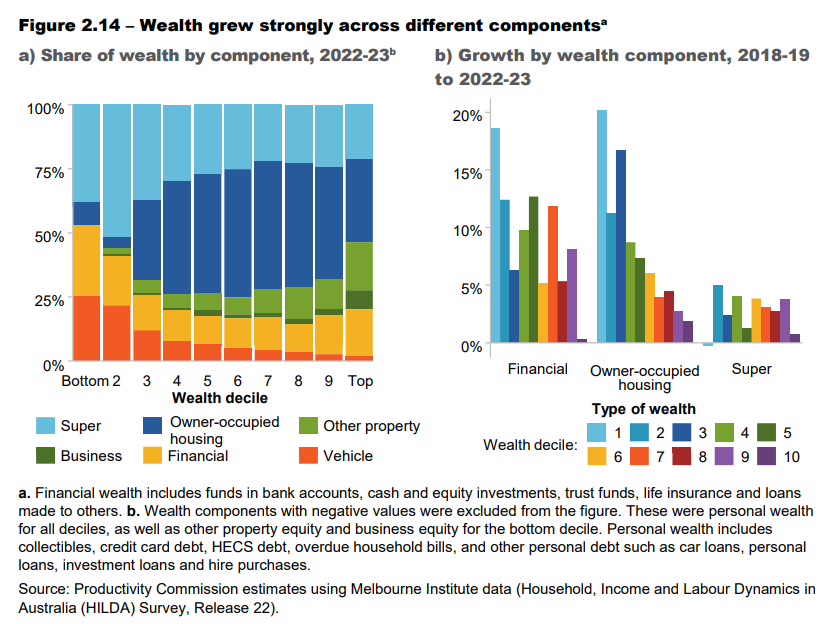
As you can see, property (owner-occupier and other) comprises the majority of wealth for middle and higher income Australians, i.e., the top 60% of households.
The next chart shows that wealth has grown strongest for older Australians aged 65-plus:
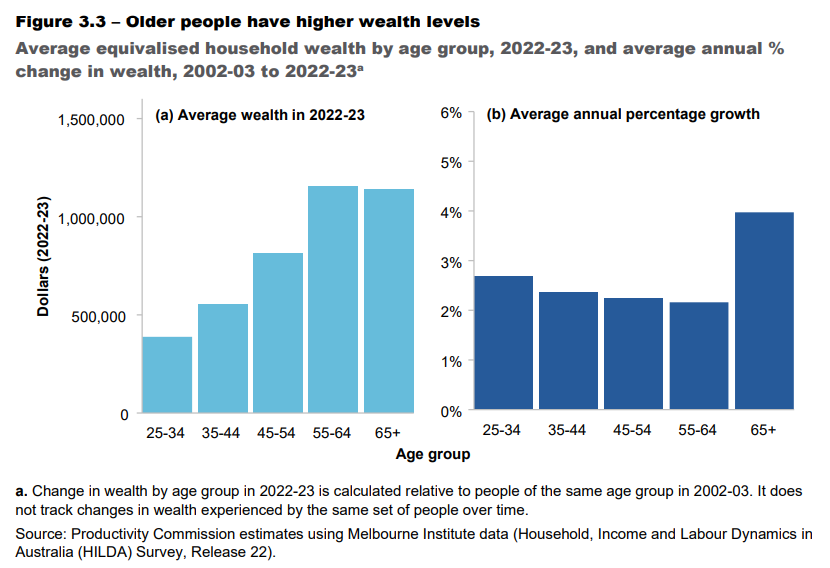
Their wealth grew at a compound rate of around 4% in the 20 years to 2022-23, roughly double the rate of younger households. This largely reflects older Australians’ higher home ownership rate.
Moreover, households in the two oldest age groups—55-64 and 65-plus—hold the most wealth.
Data on savings suggests this wealth gap between young and old would have increased further:
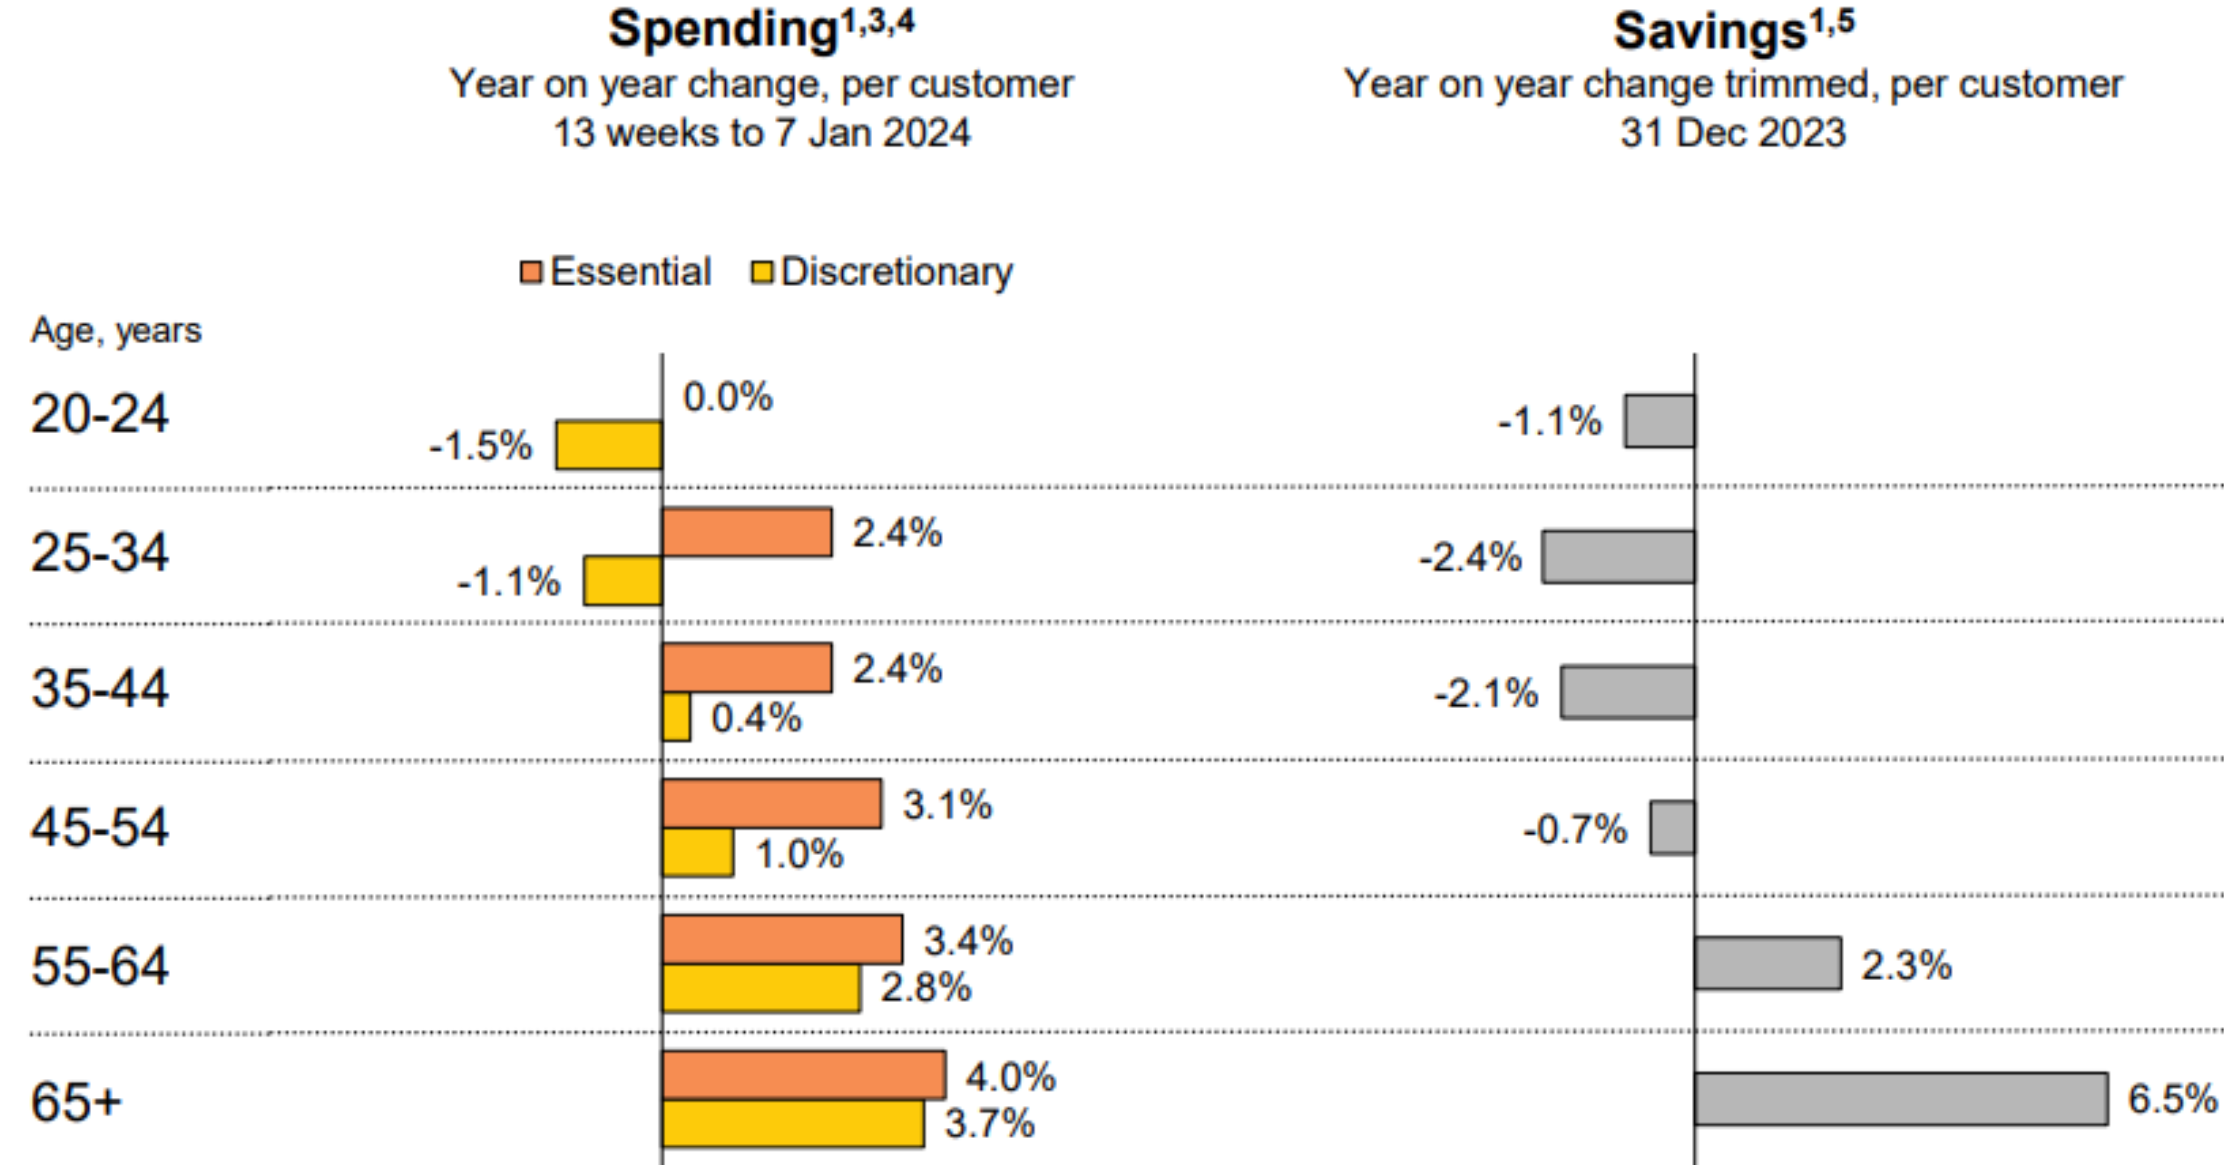
Source: CBA
Last calendar year, households aged 65 and older with accounts at CBA grew their savings by 6.5%. This was followed by households aged 55-64, who grew their savings by 2.3%.
By contrast, households aged below 54 years of age reduced their savings last calendar year, according to CBA.
The majority of older households own their homes outright and have not suffered from rising rents and mortgage payments.
In turn, these households have also increased their spending more than other households since they have greater disposable income.
To Australia’s baby boomers go the economic spoils.
