By Gareth Aird, head of Australian economics at CBA:
Key Points:
The transmission of monetary policy in Australia to the household sector and by extension the broader economy is much more direct and potent than in most other major jurisdictions, particularly when compared to the US.
A report released by the IMF on 8 April 2024 supports our view. Australia sits at the top of the global table in terms of the strongest transmission of monetary policy based on a combined scorecard of the mortgage structure, level of household debt, loan-to-value limits and housing supply constraints.
Real household income has been hit much harder in Australia since early 2022 compared to other jurisdictions. Early 2022 was when most major central banks commenced raising interest rates (including the RBA).
Fiscal policy is also a lot tighter in Australia compared to many other jurisdictions. Australian households have handed over an increasing proportion of their income to the fiscal authorities(this has largely ‘repaired’ the Budget).
The upshot is that consumer spending per capita in Australia has fallen materially since Q4 22 and further falls are anticipated over H1 24. Our outcomes sit in stark contrast to the US consumer. Lower consumer demand will mean lower inflation.
Our base case sees the RBA commence an easing cycle in September 2024 and we look for 150bp of policy easing by mid-2025.
Policy rates:
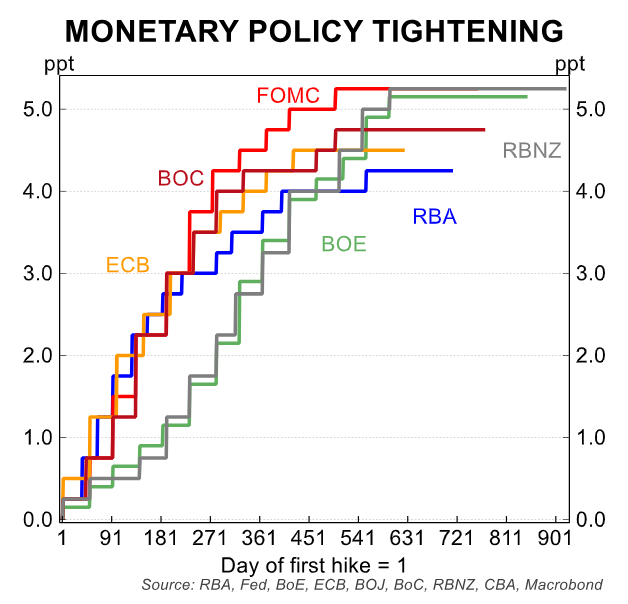
The RBA has increased the cash rate by 425bps since it commenced its tightening cycle in May 2022. This was less than many other major central banks increased their policy rates.
For example, the US FOMC has increased the US Fed Funds rate by 525bps since it started its hiking cycle in March 2022. The policy rate in Australia is ~100bps below the US policy rate.
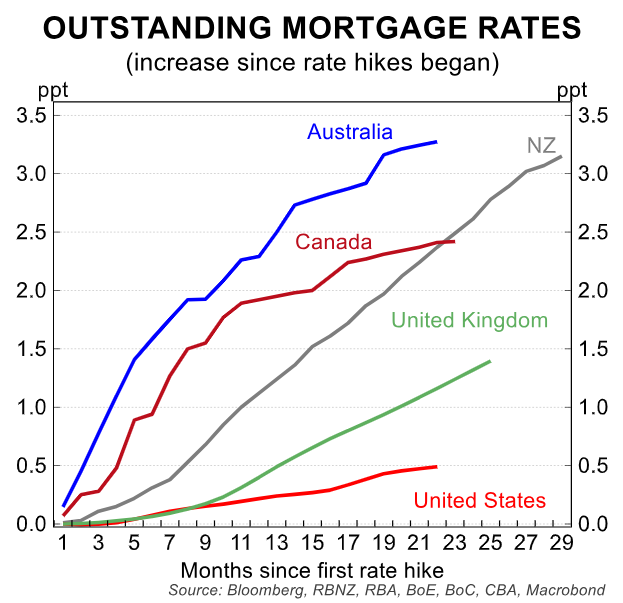
Mortgage rates:
But the average outstanding mortgage rate his risen by a much more significant amount in Australia compared to other regions.
The average mortgage rate in Australia has increased by 325bps since the RBA commenced its hiking cycle. In contrast the average mortgage rate in the US has risen by just 50bps.
The RBA gets much more ‘bang for their buck’ when they shift the cash rate because of our variable rate mortgage market.
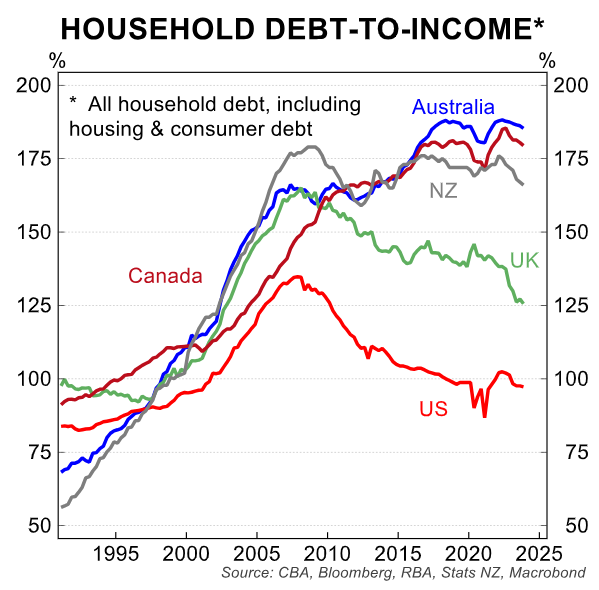
Household debt:
Australian households are amongst the most indebted in the world. This makes them more exposed to rate increases than households in most other jurisdictions.
Put another way, the high level of household debt to income augments the already more potent transmission from upward movements in the cash rate to home borrowers.
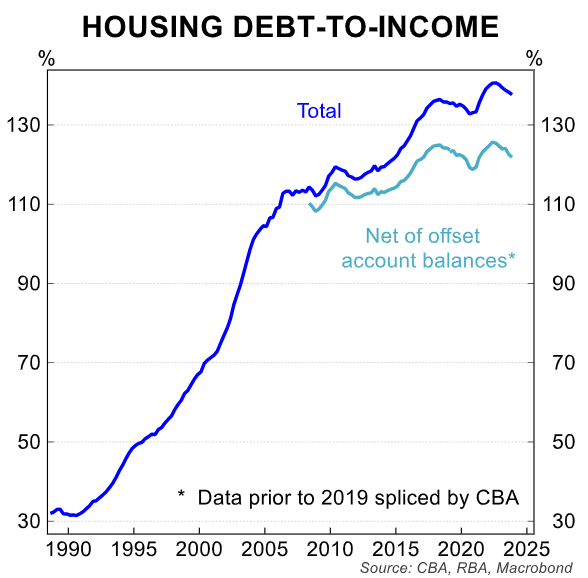
Housing debt:
Adjusting the debt picture for pure housing debt (as opposed to all household debt) to account for offset balances does not materially change the overall picture for household indebtedness in Australia.
The ratio of housing debt to income net of offset account balances still leaves Australia as one of the most highly indebted households in the world.
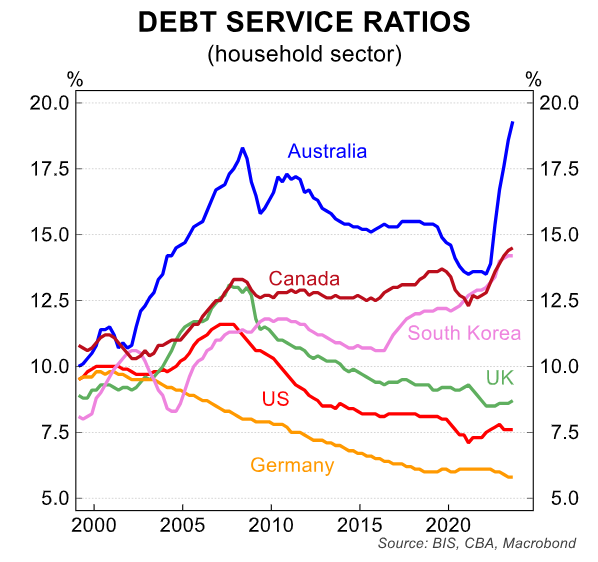
Indebtedness reflected in debt servicing:
The combination of more household indebtedness and a predominantly floating rate mortgage market has seen the debt service ratio rise more swiftly in Australia than in any other region.
The debt service ratio sits at a record high in Australia (note that these debt servicing ratios are based on methodology derived from the Bank of International Settlements -BIS).
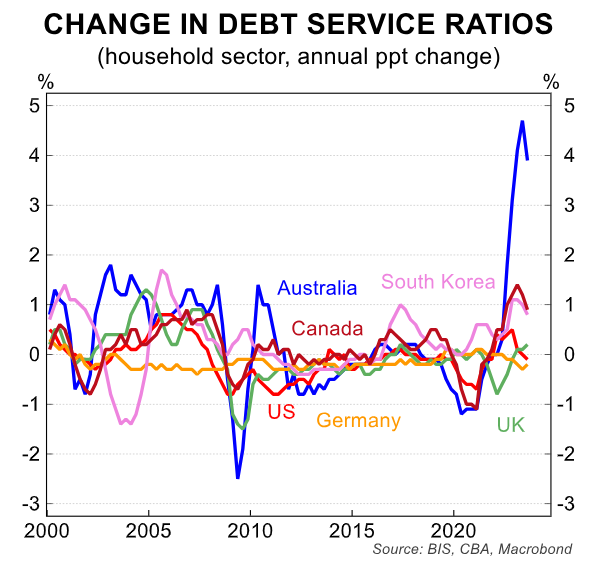
Annual change in debt service ratios:
The change in debt service ratios captures the impact of the magnitude of the hit to household finances from monetary policy (i.e. the emphasis is on the change rather than the absolute level or the starting ratio).
The change in the debt service ratio in Australia since 2022 dwarfs that of any other major region due to the structure of the mortgage market and the directness of the transmission of monetary policy.
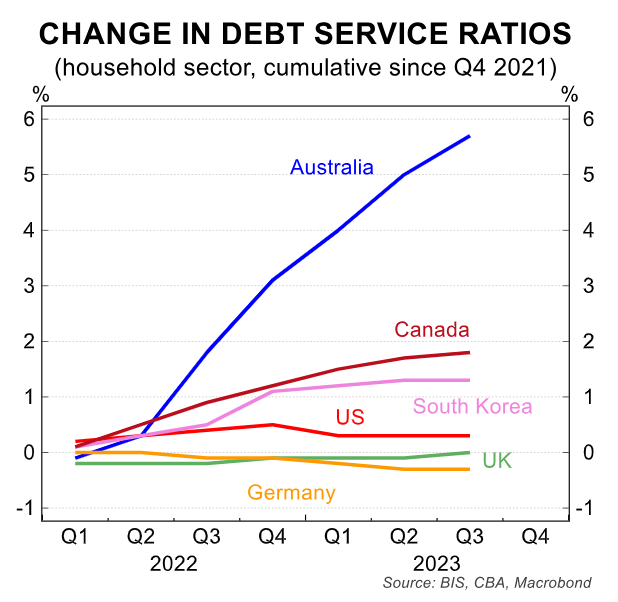
Cumulative change in debt service ratios:
The cumulative change in the debt service ratio in Australia since the global coordinated tightening cycle began is extraordinary relative to other jurisdictions (note that New Zealand is not included in the BIS database).
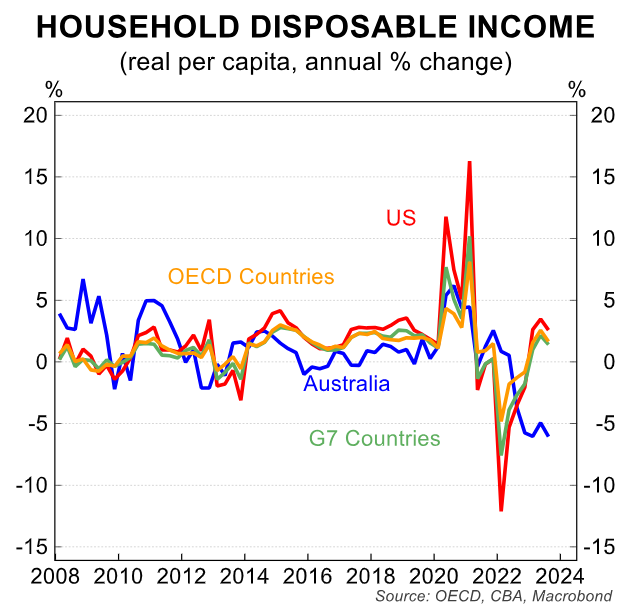
Real household disposable income:
Real household disposable income per capita has contracted sharply in Australia due to negative real wages growth, rising dwelling interest paid and taxes paid.
In contrast, real household disposable income per person has risen over the past year across most OECD countries, particularly in the US.
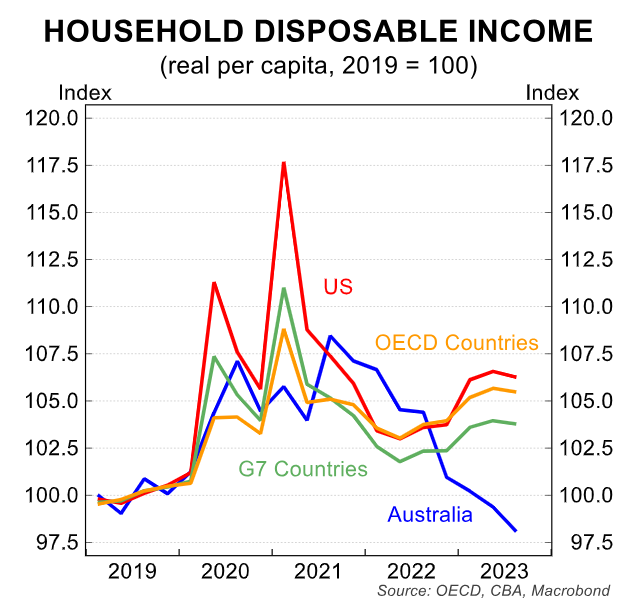
Real household disposable income:
Another way of depicting the change in the level of real household disposable income per capita is via an index chart.
Again, the chart captures the ongoing decline in real household disposable income per capita in Australia against OECD countries as a collective and the US.
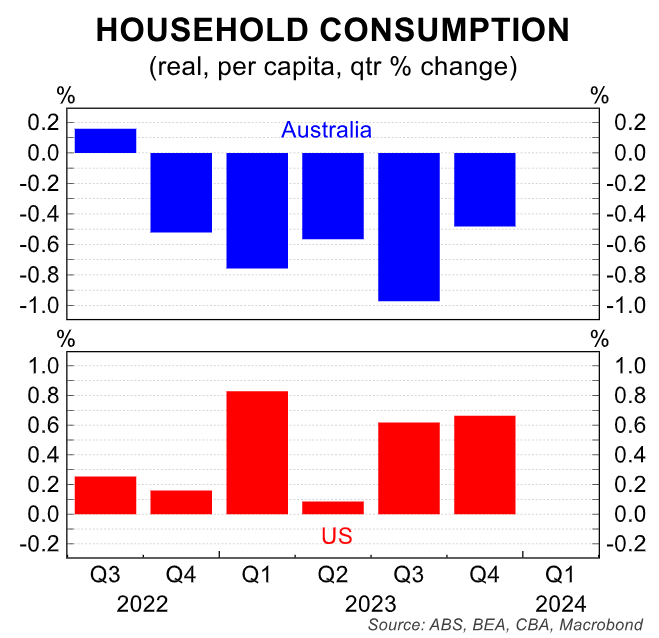
Real household consumption:
Real household consumption in Australia per person has declined for the past five quarters.
In contrast US real consumer spending per person has continued to lift each quarter over the same period.
Real household consumption per person in Australia is forecast to contract again in Q1 24.
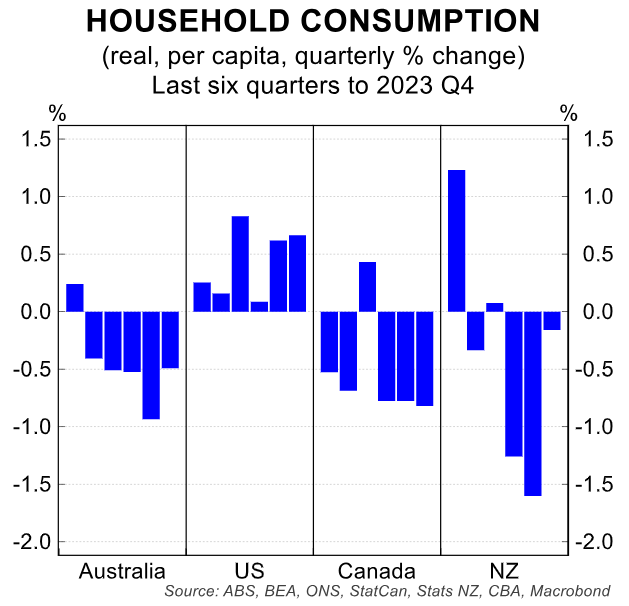
Real household consumption:
The US stands out as the clear outlier when looking at real household consumption per capita across a number of key economies.
The US household sector has barely felt the impact of the monetary policy tightening compared with the household sectors of Australia, Canada and New Zealand.
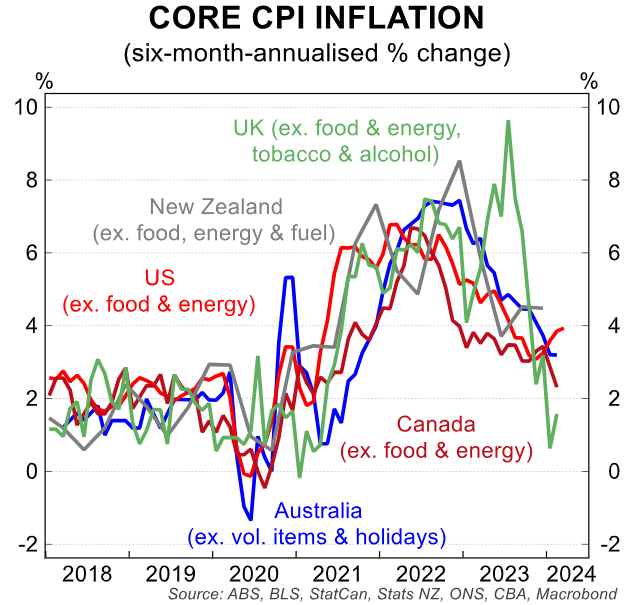
Core inflation:
Core inflation continues to move down in Australia. Six-month annualised core inflation based on the monthly CPI indicator sits just above the RBA’s 2-3% target band.
In contrast core inflation in the US has recently accelerated and is materially above the US Fed’s 2% inflation target.
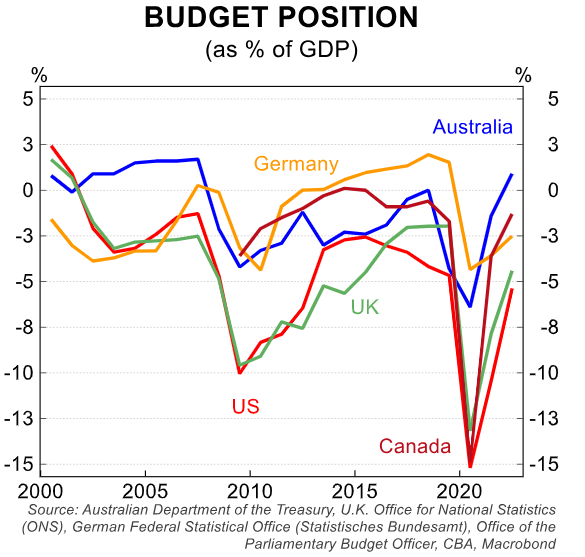
Fiscal stances vary greatly:
Fiscal stances across key economies vary greatly. The Commonwealth of Australia is running a surplus, which means it is taking money out of the economy.
In contrast the US is running a fiscal deficit ~5% of GDP.
A large part of the improvement in Australia’s fiscal position has come from households handing over a greater share of their income as taxes paid.
Fiscal policy has worked in tandem with monetary policy in Australia to slow growth in consumer demand.
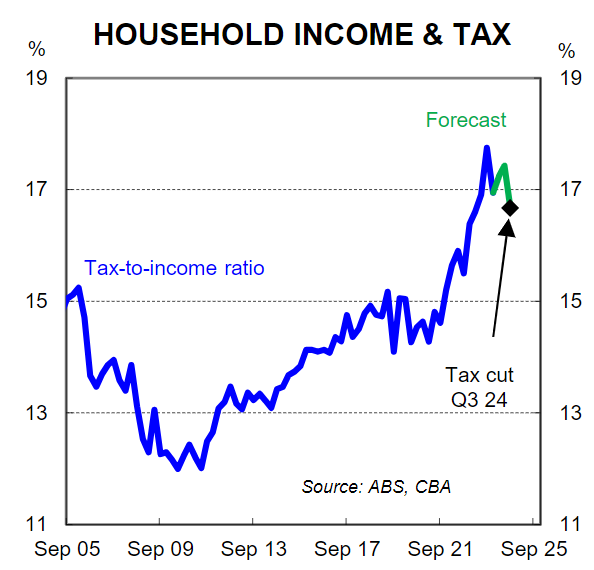
Tax cuts not enough to fend off rate cuts:
Taxpaid as a share of household income has risen sharply in Australia.
The already legislated tax cuts kick in from 1 July 2024. But we don’t believe they are sufficient in size to fend off rate cuts.
We expect the RBA to commence an easing cycle in September and look for ~150bp of cuts by mid-2025.
A key risk to our RBAcall is fiscal policy and the Government opening the purse strings (most likely in early 2025 if that risk was to materialise).