
Another hot US economic print plus continued war jitters across the Middle East caused Wall Street to pull back sharply again following the Friday night volatility. The USD pushed back against the undollars, although gold was able to rebound, while bond yields jumped to new highs across the curve. The Australian dollar made new lows below the 65 cent level.
10 year Treasury yields soared above the 4.6% level, while oil prices were volatile on the Middle East conflagrations as Brent crude range traded around the $90USD per barrel level again. Meanwhile gold was able to clawback its recent setback, finishing at the $2385USD per ounce level.
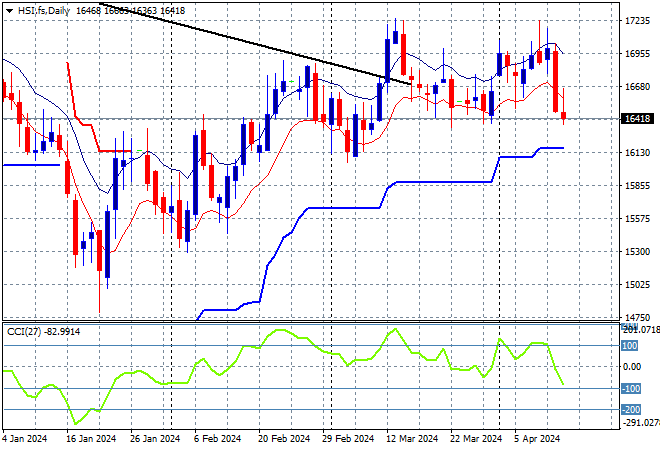
Looking at markets from yesterday’s session in Asia, where mainland and offshore Chinese share markets were still quite divergent with the Shanghai Composite lifting more than 1% while the Hang Seng Index finished more than 0.7% lower to 16600 points.
The Hang Seng Index daily chart was starting to look more optimistic with price action bunching up at the 16000 point level before breaking out in the previous session as it tried to make a run for the end of 2023 highs at 17000 points with the downtrend line broken. However this has been thwarted as monthly resistance levels are kicking in, although support at the 16400 point area is the area to watch next to come under threat:
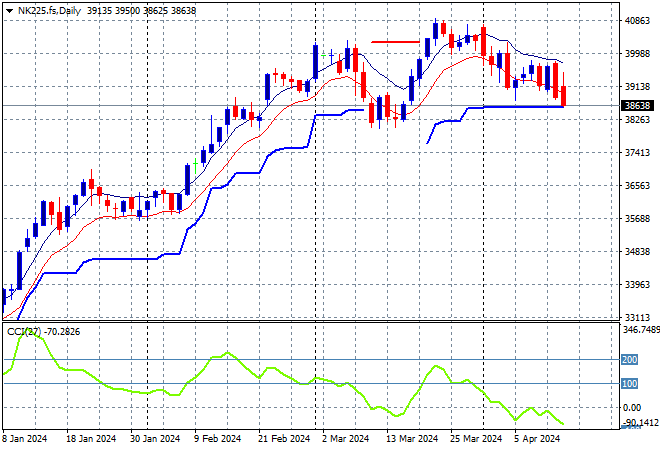
Japanese stock markets were unable to take advantage of a weaker Yen, with the Nikkei 225 down more than 0.7% at 39232 points.
Price action had been indicating a rounding top on the daily chart with daily momentum retracing away from overbought readings with the breakout last month above the 40000 point level almost in full remission. Short term resistance has been defended with short term price action now retracing to support at the 39000 point level. Watch the 38000 level for signs of a true breakdown as futures don’t look good:
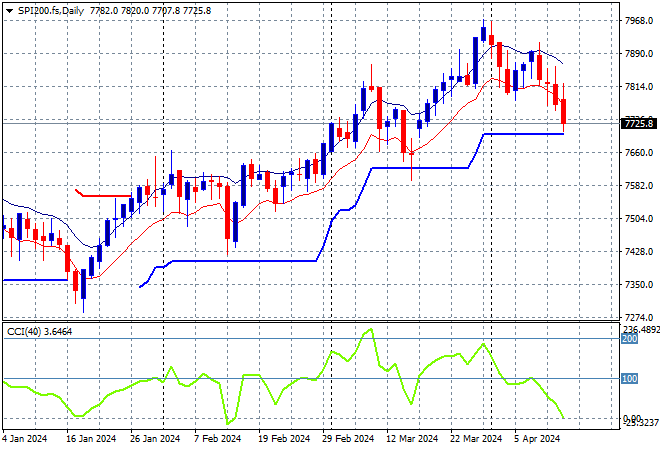
Australian stocks had minor losses with the ASX200 closing 0.4% lower at 7752 points.
SPI futures are off at least 0.8% as Wall Street continues to stumble following the weekend volatility. The daily chart was looking firmer with the medium term uptrend and short term price action coming together to take out the previous December highs. As I said previously, watching for any continued dip below the low moving average could see a significant pullback but watch ATR support which has been defended so far:
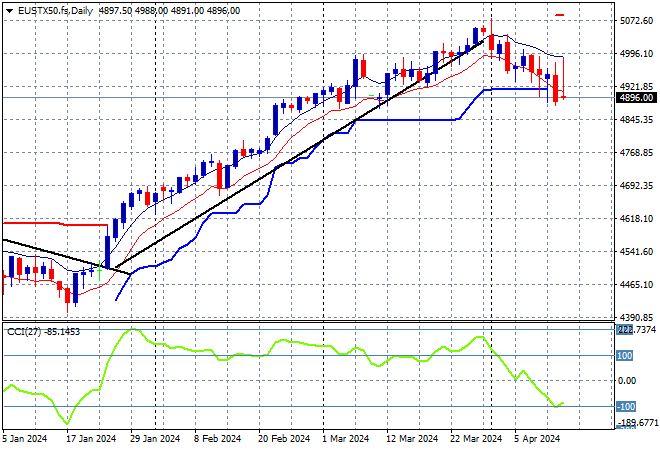
European markets were able to rebound across the continent during the physical session with the Eurostoxx 50 Index finishing 0.6% higher at 4984 points but are likely to retrace as Wall Street tumbled after the close.
The daily chart shows price action off trend after breaching the early December 4600 point highs but daily momentum retracing well out of an overbought phase. This was looking to turn into a larger breakout but this retracement back to short term support could turn into a reversal with futures showing a clear break of support at the 4900 point level next:
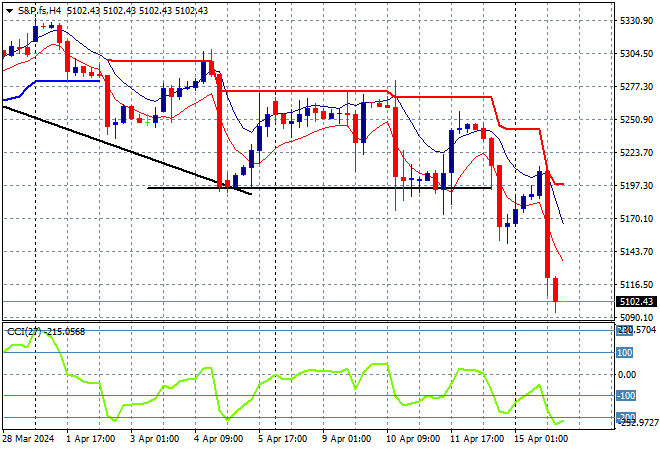
Wall Street continued to fall on war fears with tech stocks leading the way as the NASDAQ lost more than 0.6% while the S&P500 slumped nearly 1.3% lower for another new monthly low at 5061 points.
The daily chart previously showed a consolidation that could have turned into a proper reversal here as price action broke below short term support as momentum became somewhat oversold. As I said previously, this break below the 5240 point area has setup for further downside with short term resistance at the 5270 point level not coming under pressure. Watch firm support at 5000 points as a possible pausing point here:
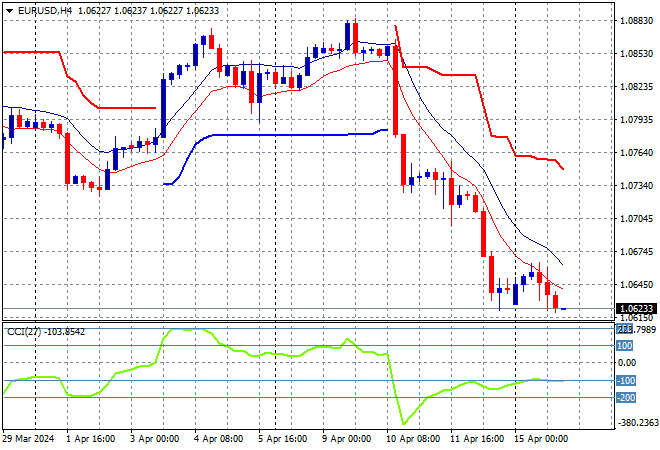
Currency markets were already in the thrall of King Dollar on the back of the US CPI print before this macro volatility with the hot retail sales print putting more fire under the USD. Euro led the charge again to make a new low, almost breaking below the 1.06 handle.
The union currency had previously bottomed out at the 1.07 level at the start of April as medium term price action with a reprieving reversal in price action back towards the 1.09 level before last week’s inflation print. Short term support at the 1.0740 has been rejected with a breakdown below that may have more downside this week:
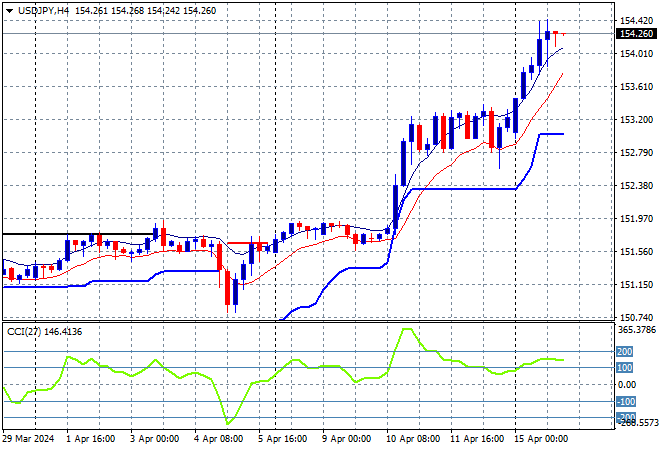
The USDJPY pair was bunching up again for another breakout, finally managing to push aside the 154 handle overnight for a new high.
The medium term picture was always somewhat optimistic as Yen sold off due to BOJ meanderings but momentum had been building before the CPI print, positive for all of the last week at least with ATR support upgraded throughout. This is likely overcooked in the short term but sets up for potential gains from here:
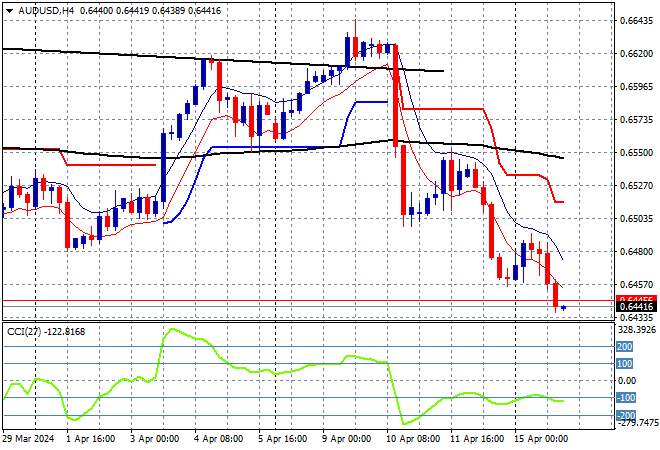
The Australian dollar continues to crack below recent weekly support to settle just above the 64 handle as risk unwinds from the commodity currency.
The Aussie has been under medium and long term pressure for sometime before the RBA and Fed meetings and while the previous temporary surge looked strong, it wasn’t overbought on the four hourly chart and had not surpassed support from last week’s consolidation phase. Watch for further downside below here as momentum remains oversold:
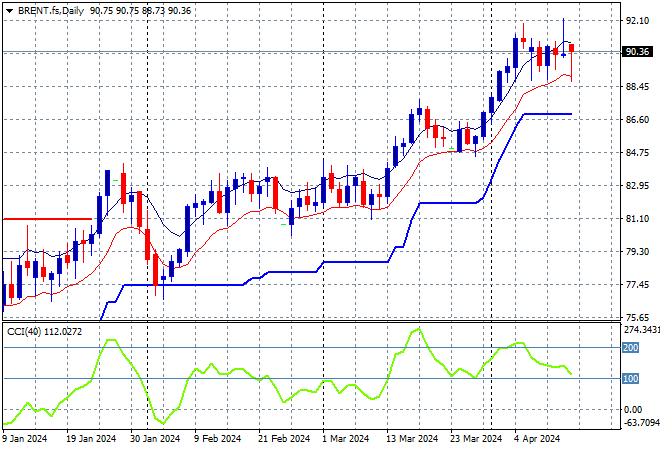
Oil markets are in a flux to say the least on Middle East conflicts with some session volatility, but Brent crude is holding fast at the $90USD per barrel level.
After retracing down to trailing ATR daily support at the $77 level, price had been bunching up around the February highs at the $84 level with short term momentum definitely overbought and signalling potential upside from here, although now well overextended. I expect a volatile breakout here soon, with probability to the upside:
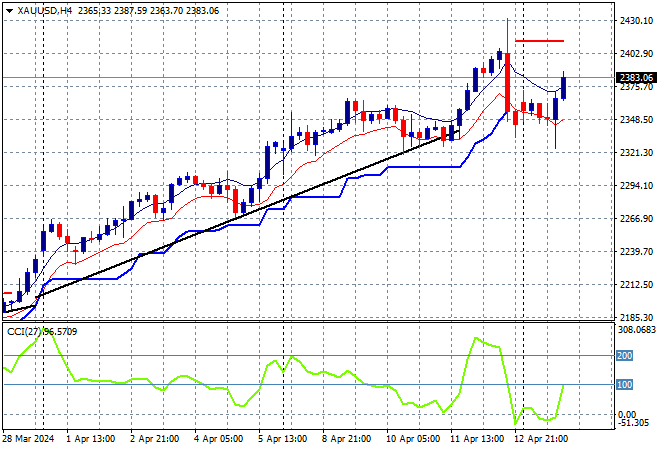
Gold had been climbing to new highs through any volatility for weeks now so a volatile retracement was not unexpected, but so far it has been defended at the $2300USD per ounce level with a solid bounceback overnight.
In the previous week momentum was nearly off the charts – never a good sign – with short term support at the $2100 level turning to what could be rock solid medium term support but still the critical area to watch ahead on a likely pullback due to excessive volatility.
Glossary of Acronyms and Technical Analysis Terms:
ATR: Average True Range – measures the degree of price volatility averaged over a time period
ATR Support/Resistance: a ratcheting mechanism that follows price below/above a trend, that if breached shows above average volatility
CCI: Commodity Channel Index: a momentum reading that calculates current price away from the statistical mean or “typical” price to indicate overbought (far above the mean) or oversold (far below the mean)
Low/High Moving Average: rolling mean of prices in this case, the low and high for the day/hour which creates a band around the actual price movement
FOMC: Federal Open Market Committee, monthly meeting of Federal Reserve regarding monetary policy (setting interest rates)
DOE: US Department of Energy
Uncle Point: or stop loss point, a level at which you’ve clearly been wrong on your position, so cry uncle and get out/wrong on your position, so cry uncle and get out!